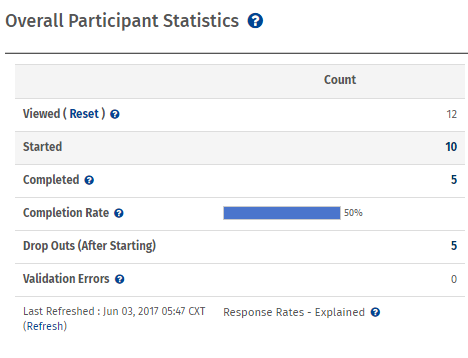
This helps in gauging the performance of your surveys and further improving the response rates. Your survey participant statistics are as follows
Viewed: This is the total number of users who click on the link for the survey. Every time your survey is requested, the view count is incremented and updated. The respondent does not necessarily have to start the survey.
Started: This is the total number of respondents that have started the survey. If your survey has branching or page-breaks, a response is recorded as 'Started' if the 'Continue' button on the first page is clicked.
Completed: The completed count includes all respondents who have gone through the whole survey and completed it by clicking on the Finish button on the last page of the survey.
Completion rate: This is equal to Completed Survey Responses divided by the number of Started Survey Responses.
Drop outs: This is the number of respondents who start the survey but do not complete it.
Validation Errors: This is the number of times someone has encountered a validation error during the survey.
Terminated via branching: EIf you have set up the branching in your questions to terminate the survey for criteria, then the number of terminated respondents will be displayed in this column. Please note that this will only be displayed if you have set up branching to the termination.
Example of participant statistics in a survey
Let us consider an organization that is conducting customer satisfaction surveys. After launching the survey, they can view the survey respondent details to determine the performance of the questionnaire. Using the data of views, responses, and drop-outs, they can determine the next steps. This also helps in planning and figuring out the right time to send surveys the length, types of questions, etc.


Uses of participant statistics in surveys
Your database plays a vital role in conducting online surveys. You need to have data that is segmented, verified, and, most importantly, current. Using this online survey setting, you can determine how good the quality of your data is. You can evaluate that with the number of surveys delivered, answered by your respondents, and the type of responses.
Advantages of creating surveys with participant statistics
Survey performance: Using this survey setting, you can understand how well your online surveys performed. Did a decent number of participants answer your online survey questions? What percentage of respondents dropped out, and at what stage? These are just some key questions that this questionnaire setting will answer and improve your survey response rate.
Survey cadence and time: Getting the maximum number of responses for your surveys is crucial to understand what your customers are thinking, how happy and satisfied they are with your product or service, etc. This also lets you understand if your surveys' timing and cadence are ideal for gathering maximum responses.
Data quality: Your survey data needs to be updated at all times. Without that, you may not be able to get the right amount of responses, and the accurate data you’d need for future planning. Using participant statistics lets you analyze your data and check its validity and quality.
How to use participant statistics in surveys
To use participant statistics in surveys, read our help files on how to set up participant statistics.
Survey Software Easy to use and accessible for everyone. Design, send and analyze online surveys.
Research Suite A suite of enterprise-grade research tools for market research professionals.
Customer Experience Experiences change the world. Deliver the best with our CX management software.
Employee Experience Create the best employee experience and act on real-time data from end to end.


