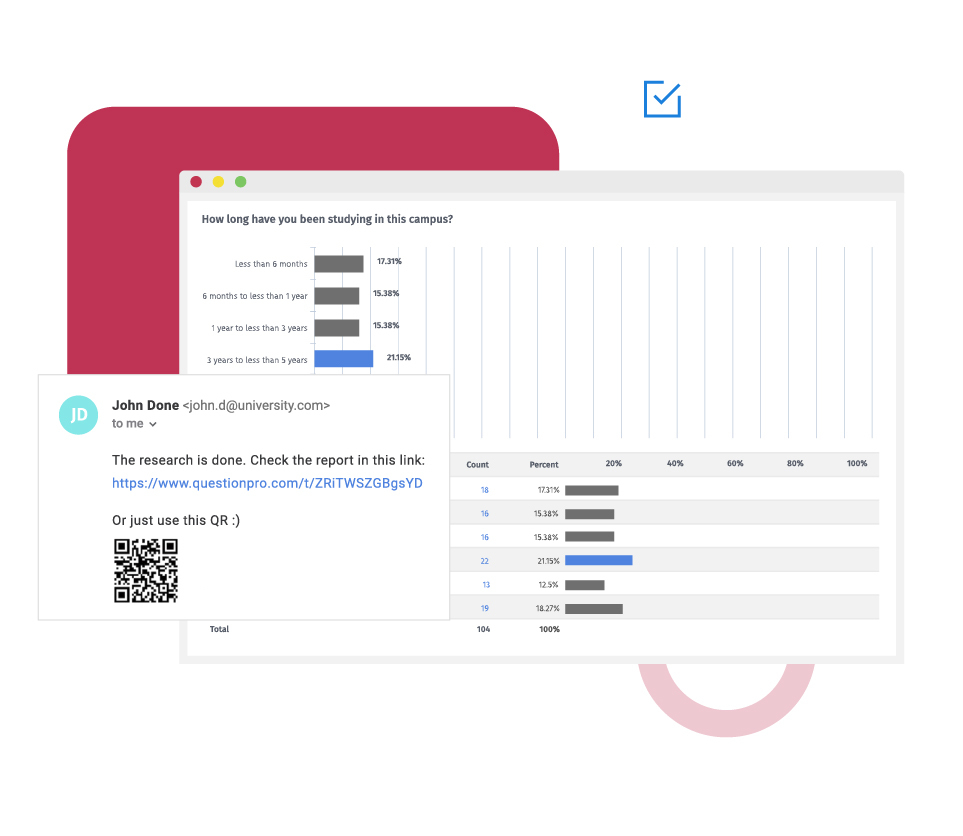
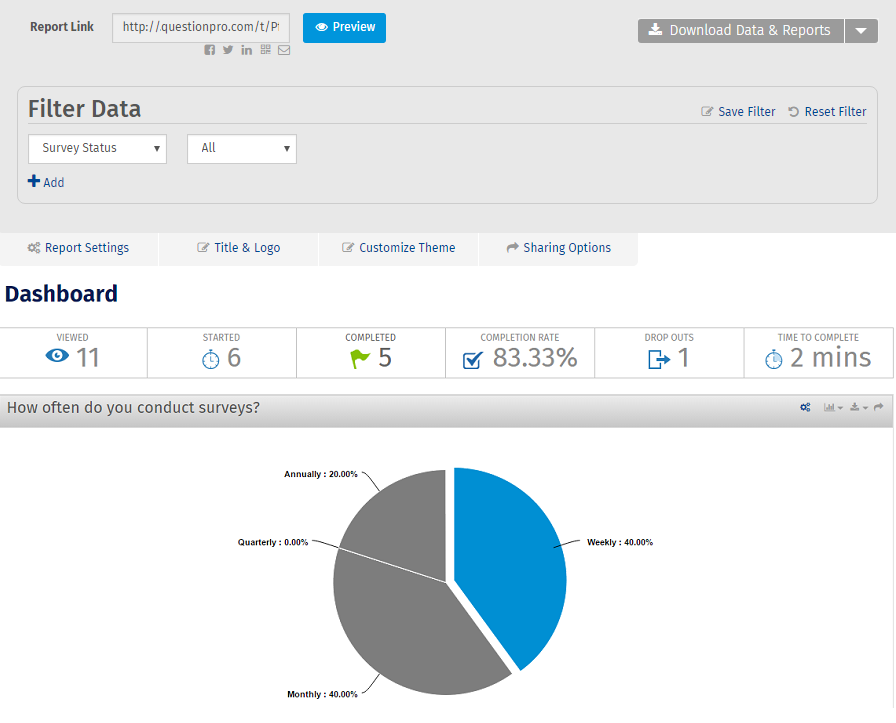
Some of the real-time insights you can get from a dashboard report are response distribution, graphs, charts and survey completion rate.
With graphs and charts, you can consume the data visually. It becomes easy to analyze how the survey participants responded and the overall pulse of the audience. As the real-time dashboards let administrators look at specific questions, they can identify general trends. Real-time survey results help when organizations do online surveys across various regions and time zones. They can watch for global trends as well as dive into individual results.
While real-time dashboard reports are good to get a quick idea, you can drill down data further with wide range of options like filters, custom views, segmentation and more.
With QuestionPro, you can save custom dashboards so that you don't have to recreate the view for different stakeholders. Just create it once and save for the next time! Switch between them on the fly effortlessly and compare various datasets.
Examples of real-time reports in a survey
Consider a brand has rolled out a customer survey for one of their products. They need to gather feedback to make sure their product meets the needs of the customers. Real-time surveys let you collect data at the point of experience while the emotions are still fresh. Hence the reports generated from the real-time data offer accurate insights. They enable businesses to take actions, right when it matters the most.

Uses of real-time reports in surveys
Real-time reports are commonly used for live polls and online quiz when you need to view the results instantly. Live dashboards let you see the top responses and their distribution after each question. Real time response analysis offer an excellent way to measure the perfomance of the survey. It lets you decide if you need to tweak any questions or offer rewards to the respondents.
Looking at the real-time survey responses helps market researchers collaborate with other teams to start planning further research or marketing efforts. This data can also be used by sales and customer success teams to improve upon customer experience (CX), customer retention, and other customer operations.
QuestionPro lets you create branded dashboards with custom look and feel, logo, colors and more.
Advantages of creating surveys with real-time reports
Share results fast: You can show real-rime survey responses and share results with your participants. It enables you to build relationships and boost survey participation for the future too.
Study trends in real-time: Studying real-time responses helps you look at trends early on and use them to define or revamp your research or marketing plans. You can find out which way your respondents are leaning towards and optimize your campaigns accordingly.
Check on your survey progress: The real-time dashboard presents detailed information to administrators such as successful survey completions, drop-outs, time taken for survey completion, etc.
Export survey respones: Export the visual charts into standard formats like .xls, .doc, .ppt and .pdf, or share the report url conveniently.
Survey Software Easy to use and accessible for everyone. Design, send and analyze online surveys.
Research Suite A suite of enterprise-grade research tools for market research professionals.
Customer Experience Experiences change the world. Deliver the best with our CX management software.
Employee Experience Create the best employee experience and act on real-time data from end to end.


