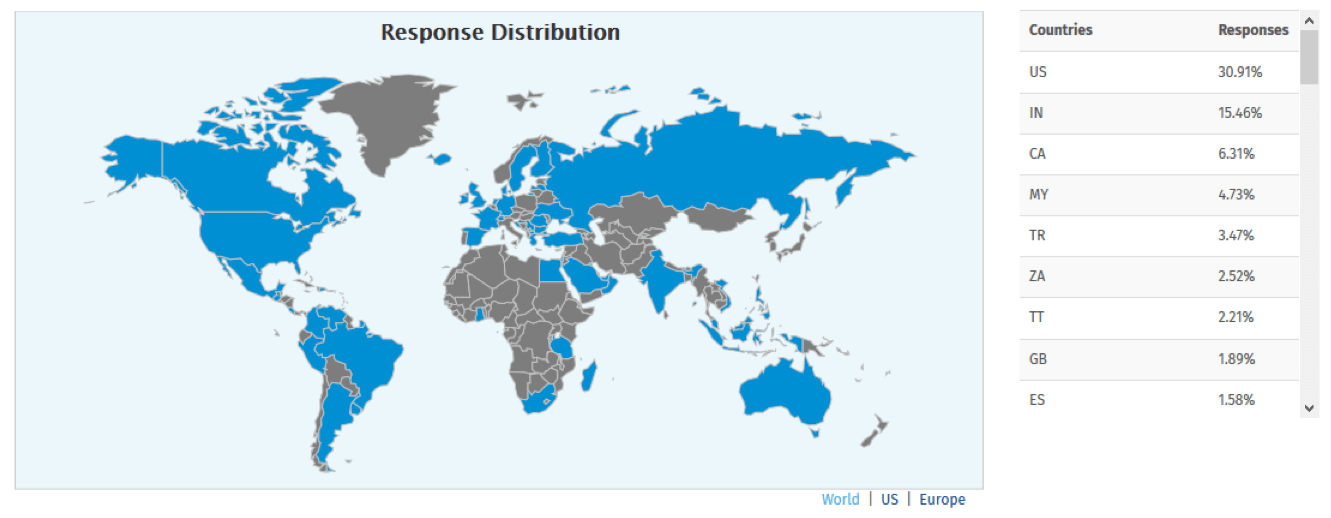
Utilizing this option lets you understand which regions are more responsive to your online surveys and indicate the percentage of responses from a particular region. This makes it easy to compare the responses from the other areas.
Example of response map in a survey
Consider a Software as a Service (SaaS) brand that provides an email marketing platform to its global consumers. They want to conduct a market research study to see where most of their customers lie. Using just essential or a minimal number of questions in their online survey, they can clearly identify which areas of the world have the maximum number of users of their tool.

Uses of response map in surveys
Retail stores or car dealerships that are spread across various cities need to cater to all of them, and that may get hard sometimes. While you can segment your data and run surveys or marketing campaigns accordingly, there is a better option, to begin with. You can use a response map to study where your respondents are densely populated and then move on to other steps. A region with ten respondents amongst a data size of 10000 people may not warrant aggressive survey or marketing efforts. You may prefer in-person or over-the-phone surveys. Response maps can help you evaluate your data to define and execute your strategies.
Advantages of creating surveys with response map
Responsiveness to your research: Conducting online questionnaires with the response map can tell you which regions in your database are most responsive to your surveys or even newsletters and marketing emails. Based on the survey analytics generated in the tool, you can isolate which regions have the highest open rates, response rates, drop-out rates, etc.
Compare regional score: Once you know which regions are responsive to your online questionnaires, you can do comparative studies. Based on this, you can define or refine your product updates, marketing strategies, pricing structures, etc. The more the responses from a region, the better your data collection and analysis will be.
Devise future action plans: If you can identify a region where most of your survey responses are coming from, you can infer that’s where most of your customers are based. Using that information, you can devise action plans to engage and serve them better.
How to use a response map in surveys
To use report sharing in surveys, read our help files on how to set up a response map.
 Survey Software
Easy to use and accessible for everyone. Design, send and analyze online surveys.
Survey Software
Easy to use and accessible for everyone. Design, send and analyze online surveys.
 Research Suite
A suite of enterprise-grade research tools for market research professionals.
Research Suite
A suite of enterprise-grade research tools for market research professionals.
 Customer Experience
Experiences change the world. Deliver the best with our CX management software.
Customer Experience
Experiences change the world. Deliver the best with our CX management software.
 Employee Experience
Create the best employee experience and act on real-time data from end to end.
Employee Experience
Create the best employee experience and act on real-time data from end to end.