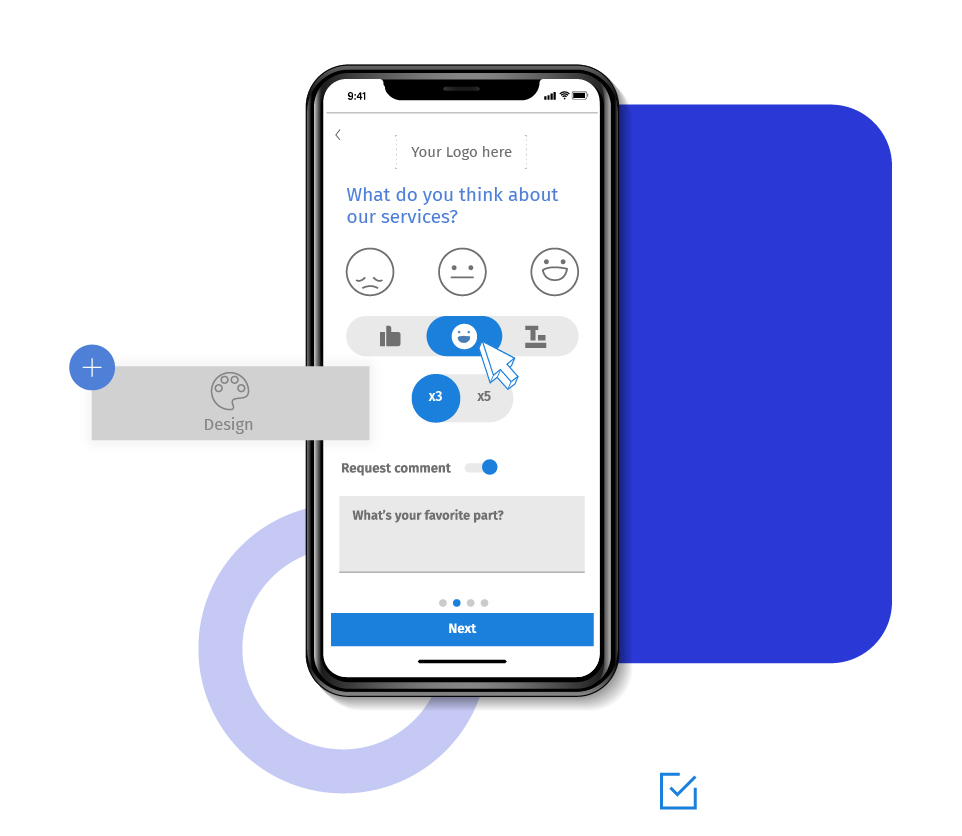
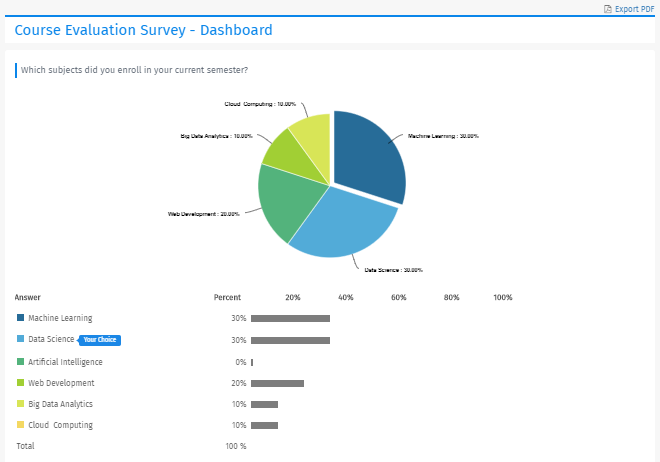
Spotlight report shows a pie chart and bar chart of the response distribution and percentages for each answer option. Survey creators can customize the chart type they want to present to the respondents. This report similar to a real-time summary report, except the spotlight report shows a “Your Choice” pointer to every respondent. Respondents can also download this report in the form of a PDF file.
Example of a spotlight report
Consider a university that wants to conduct a course evaluation survey. The spotlight report will show the percentage of students who have opted for various courses. Thus, they will be able to compare their choices or experiences with others.

Survey finish option - Spotlight report
Generally, once the respondents answer all the questions, they are shown a 'Thank you' page. Survey-creators can present spotlight report to give a more personalized feel to the respondents. It is one of the many survey 'Finish options' that QuestionPro supports. Some of the other finish options are:
Standard options:
Advanced options:
Automatic redirect: Set a predefined webpage where you want to redirect the respondents after they complete the survey.
Forward to friend: Allow respondents to forward the survey to others.
Review/Print: Let respondents print their survey.
Rewards: Offer rewards to your respondents based on various criteria.
Panel integration: Integrate with 3rd party panels to buy respondents for your survey.
After selecting the finish option, you can configure the survey tool to compare the results with other parameters. This option sets a filter for the spotlight report. Once you create a data filter, the respondents who fall under this filter would be able to see the spotlight falling under that particular criteria.
For instance, consider the question, 'What is your gender?' Apply filter on the spotlight for the answer option male. Now, if a respondent selects the option male, he would be shown the spotlight compared to all the respondents who selected the same option.
You can define your custom spotlight criteria. QuestionPro offers two options to set your rules.
Responses to survey question: Set if a specific answer option of any question is selected.
System variable / Geo location: Choose custom variables, system variables, geolocation filter, geolocation value, email list or device type to filter data.
Learn more: Data segmentation and filtering analysis.
Note: Spotlight doesn’t show responses to open-ended questions.
Uses of a spotlight report
Comparison with other respondents: Spotlight report can let respondents know how was their experience as compared to others. They can also find out what is the most popular choice from the given options.
Online quizzes: These surveys make one of the best use-cases for the spotlight report. Respondents will find it interesting to see how they scored as compared to other respondents.
Advantages of a spotlight report
Instant results: A survey spotlight report shows a real-time summary report to respondents immediately after they complete the survey. Thus, they don’t have to wait to know how their choices compare with others.
Better respondent experience: A visually appealing page is a great way to give an excellent experience to the survey-takers.
How to enable spotlight reports for your surveys
Learn how to set up and use this feature with our help file on Spotlight Report.
Survey Software Easy to use and accessible for everyone. Design, send and analyze online surveys.
Research Suite A suite of enterprise-grade research tools for market research professionals.
Customer Experience Experiences change the world. Deliver the best with our CX management software.
Employee Experience Create the best employee experience and act on real-time data from end to end.


