- Custom Variable Widget
- Priority Matrix
- Heatmap Widget
- Grid Widget
- Weighted mean widget
- Comment List widget
- Widget Filters
- Ranking List Widget
- Distribution Chart
- NPS Widget
- Trend Widget
- Word Cloud Widget
- Cross tab widget
- KPI Comparison Widget
- Bubble chart
- Custom Metric Trend Chart
- Trend Comparison Widget
Custom Metrics in CX
Custom Metrics is about providing configurable metrics to view the analytics. Custom metrics can be a simple Top box score of a single select question or can be a combination of scores of more than 2 questions. Example: You can multiply the responses of two questions which are of type multiselect or single select, save it and perform any kind of analysis later on.
- Say a user has a question in the survey - What is the one milk product you like? For this user, the key metric can be the number of users who likes ice-cream. He should be able to set this as a metric.
- Say a user has a matrix question of 3 attributes to measure the satisfaction of the customer For them, the key metric can be average/mean of the scores of all the three attributes which he might want to call an Overall Average CSAT.
In order to enable the Custom Metrics functionality, we need to perform some prerequisites:
- Create a Survey, add survey logic (wherever required)
- Click on Deploy
- Add the workflow rules
- Click on the Analytics tab, and then under the "Analysis" page you will find the “Custom Metrics”
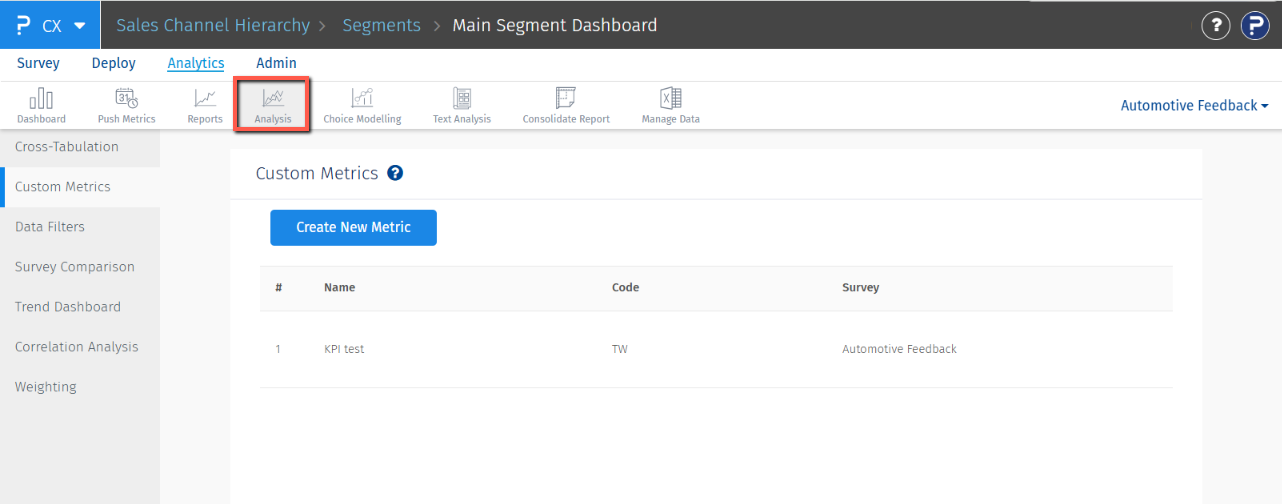
- Click on Create New Metric, provide the metric name
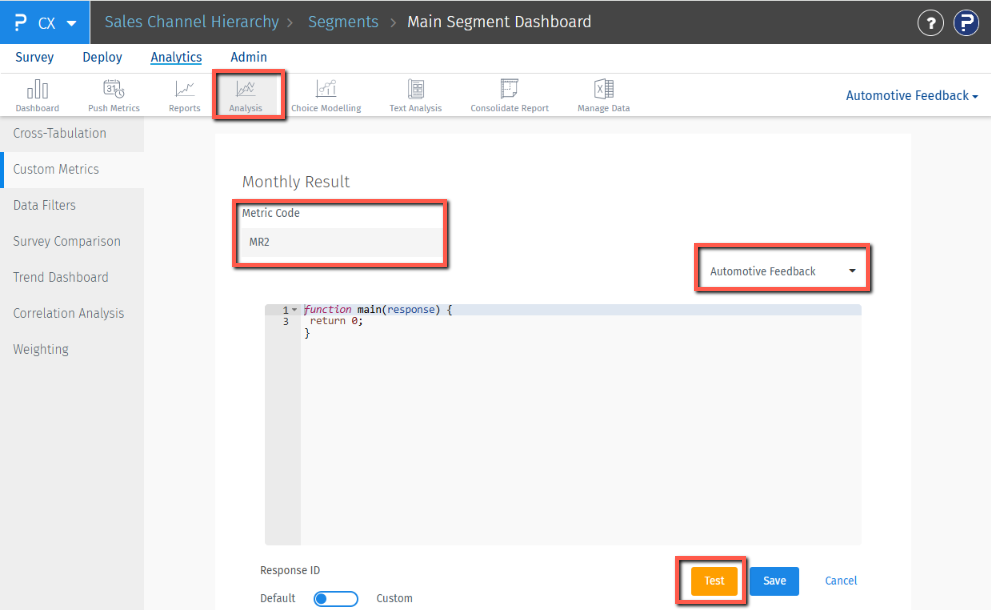
- On the next screen, add the Metric code and select the survey on which you wish to apply logic on.
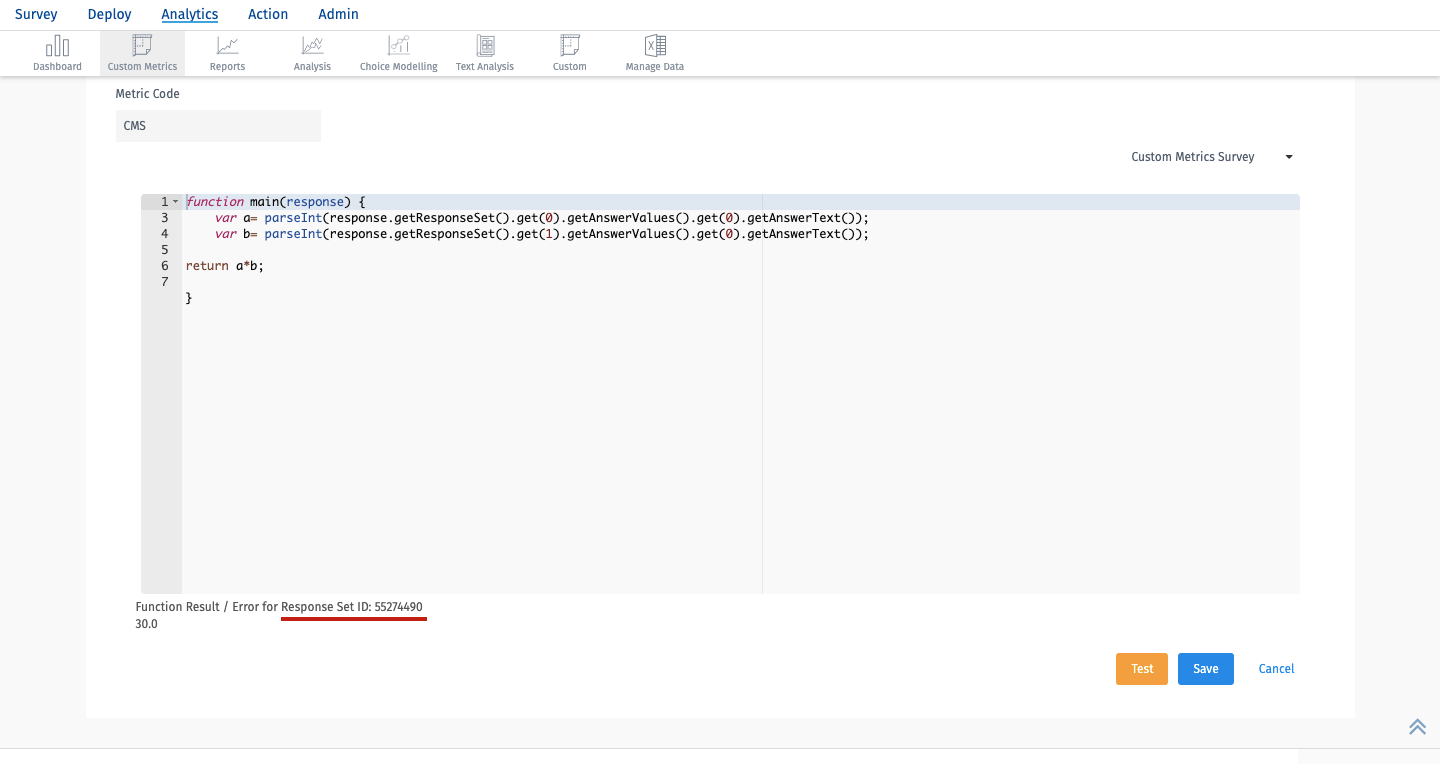
- Click on the Test button. This will provide you with a Response ID.
- Perform the technical steps as mentioned below. Once your technical steps are complete, we need to add a code.
- Click on the Save button, when you have written the code and enable the responses in the response viewer for the Custom Metrics.
- Now, deploy the survey as the normal process.
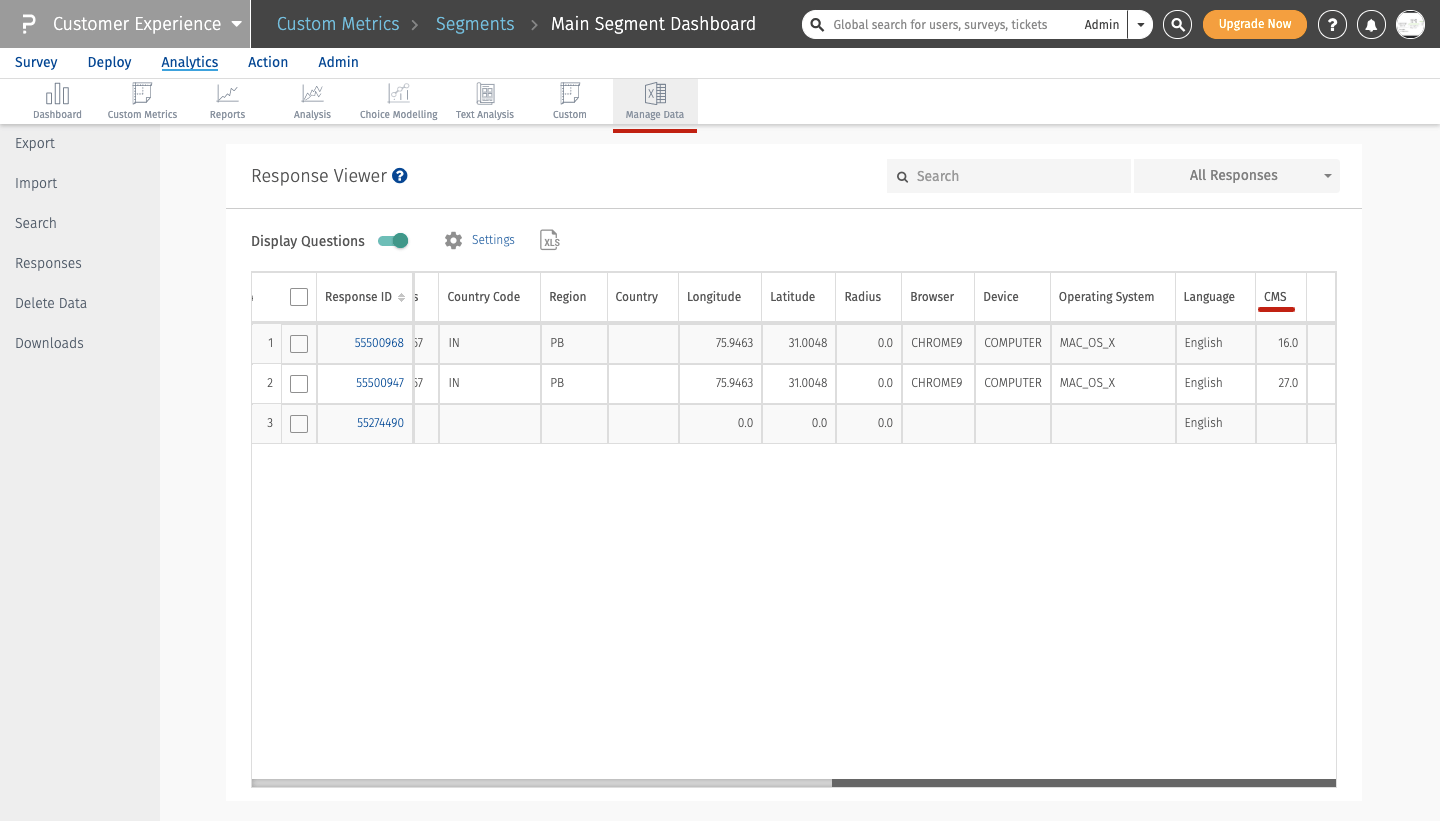
- Once you start receiving the responses, you will be able to view the Custom Metrics responses like this:
The rebuild feature helps in recalculating custom metric values for the responses present in the survey. Users can select the date range for which they want to recalculate the custom metric scores. This feature can be helpful where responses are collected in the past and the user wants to create custom metric scores for such responses.
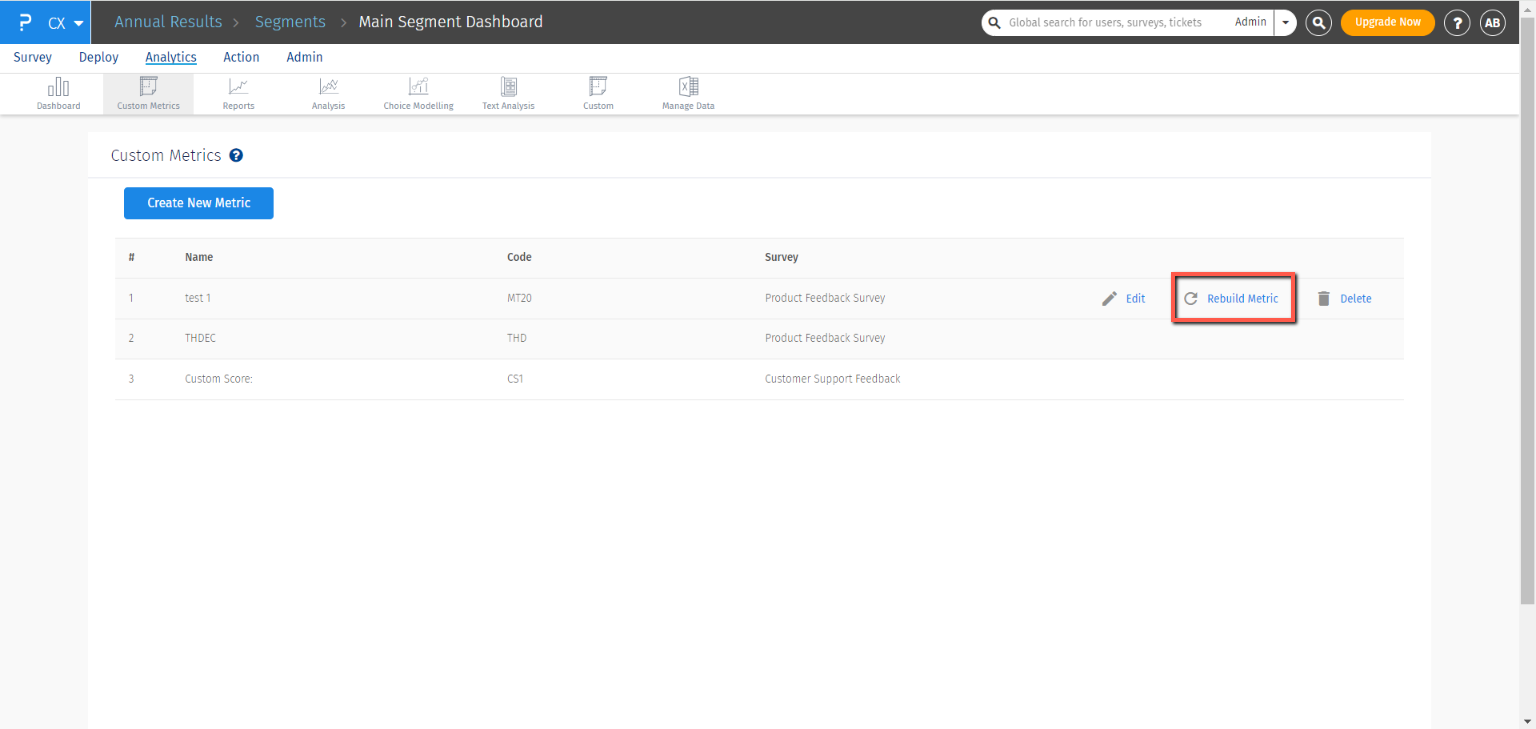
In the “Custom Metrics” window under the “Analytics” section, all the custom metrics present in the workspace will be shown. When hovered over the custom metric action item will be shown as Edit, Rebuild Metric, and Delete. Click on “Rebuild Metric”, which will open the “Rebuild Custom Metric” popup.
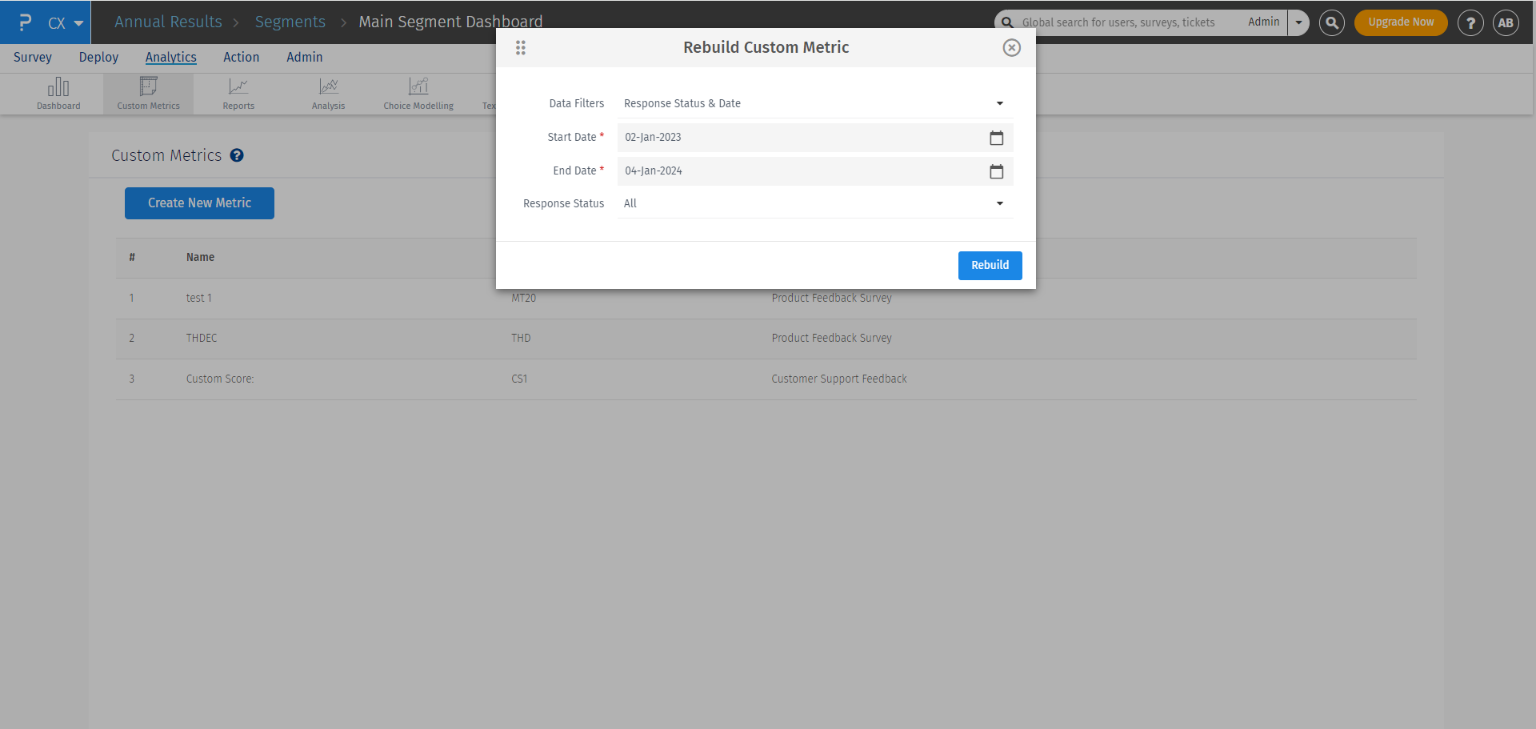
- Data Filters: Users can choose from already-defined data filters from here
- Else, users can set the start date, end date, and response type for which they want to rebuild the custom metric
- Once all the details are added, users can click on the “Rebuild” button to calculate the custom metric scores
Prerequisite Steps:
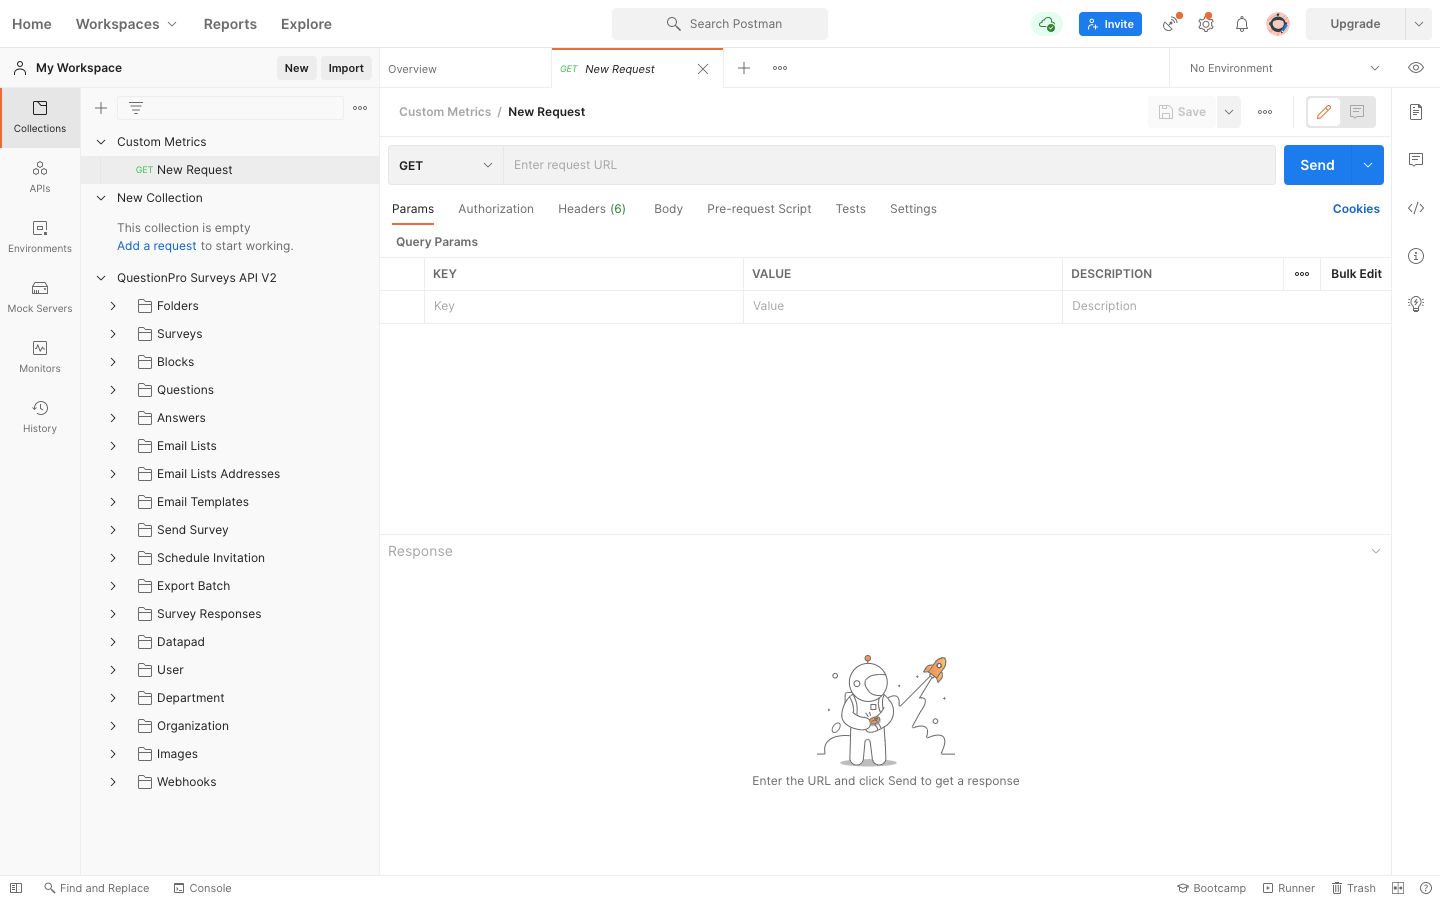
- Run the link mentioned below in the postman
- The screen will show a link like- https://api.questionpro.com/a/api/v2/surveys/{{survey-id}}/responses/{{response-id}}?apiKey={{apiKey}}
- Add the survey ID, response ID and the apikey in the link.
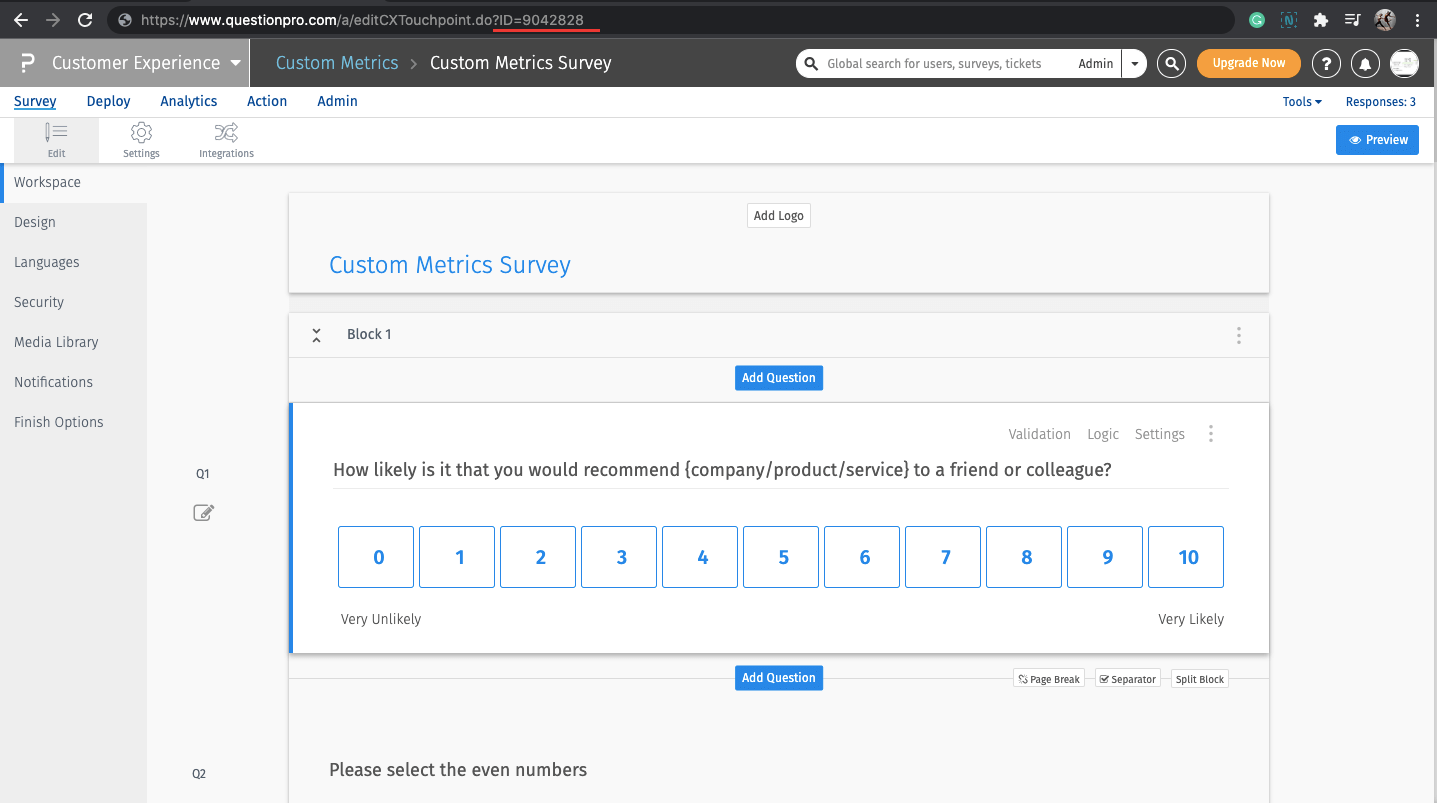
- For Survey ID: Click on the survey for whom you need the survey ID.
- For the Test Response ID: Click on the Analytics >> Custom Metrics >> Test button for generating the test response ID
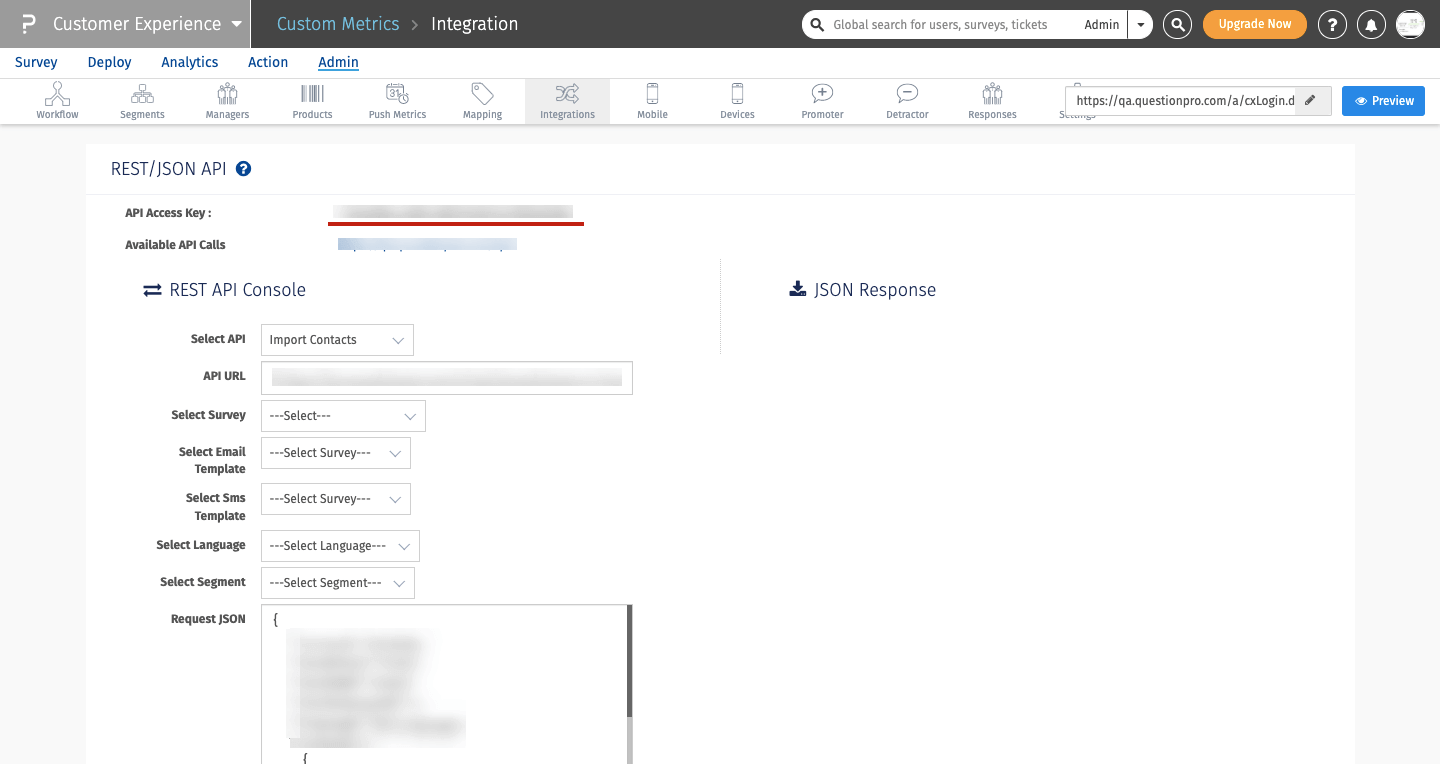
- For apikey: Click on the Admin >> Integrations >> API Card and you will get the API Access key specific to the survey
Once you have the API response from the Postman, let’s build a logic on the response received:
Task: Let’s multiply 2 numbers from the responses received.
Assumptions: Assuming we want to do the multiplication of the number received from question1 and option 1 of question 2. Here, question 2 is a multi select question, then:
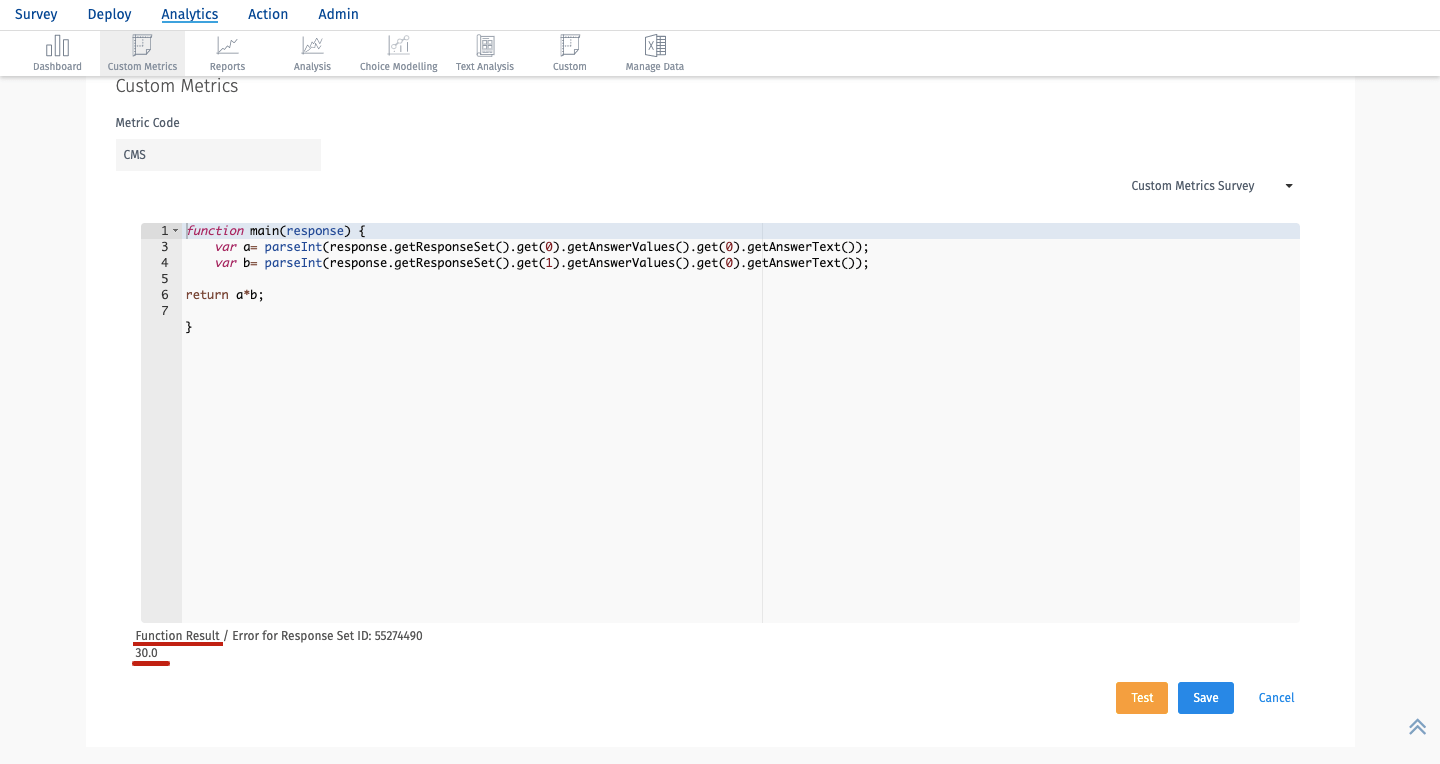
CODE:function main(response) {
var a= parseInt(response.getResponseSet().get(0).getAnswerValues().get(0).getAnswerText());
var b= parseInt(response.getResponseSet().get(1).getAnswerValues().get(0).getAnswerText());
return a*b;
}Here, get(0).getAnswerValues() >> corresponds to the question 1 of the survey
And, get(0).getAnswerText() >> corresponds to the 1st option of the question 1
Similarly, get(1).getAnswerValues() >> corresponds to the question 2 of the survey and get(0).getAnswerText() >> corresponds to the 1st option of the question 2.
function main(response) {
var a= parseInt(response.getResponseSet().get(2).getAnswerValues().get(0).getAnswerText());
return a;
}
function main(response) {
var a= response.customVariables['val'];
var b= a*1;
return b;
}
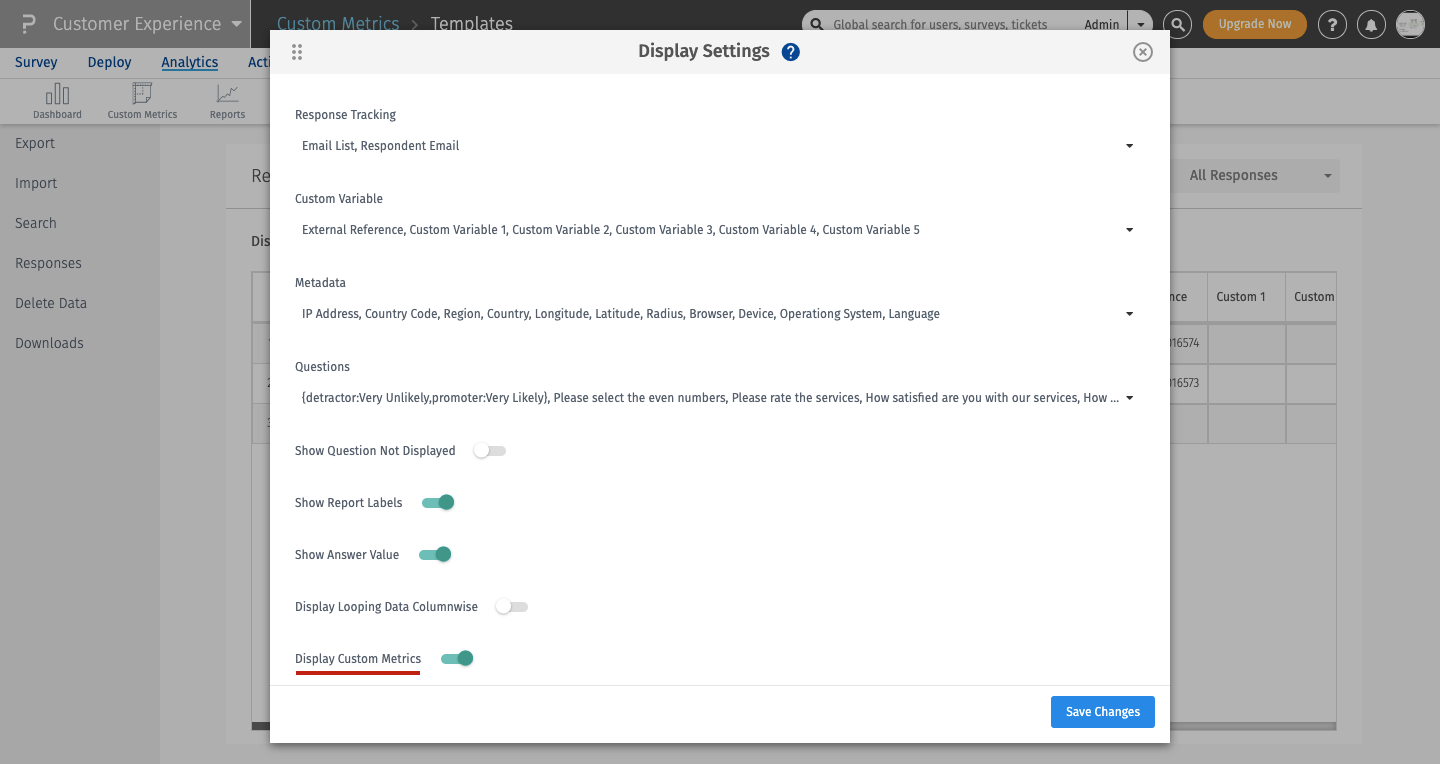
In order to view the responses of the logic applied in Custom Metrics screen for the transactions, click on Analytics >> Manage Data >> Responses >> Settings >> Display Custom Metrics >> Save Changes
