- Custom Variable Widget
- Priority Matrix
- Heatmap Widget
- Grid Widget
- Weighted mean widget
- Comment List widget
- Widget Filters
- Ranking List Widget
- Distribution Chart
- NPS Widget
- Trend Widget
- Word Cloud Widget
- Cross tab widget
- KPI Comparison Widget
- Bubble chart
- Custom Metric Trend Chart
- Trend Comparison Widget
Dashboard Settings
Go to Login » Customer Experience » Analytics » Dashboard Once you are on the dashboard for which you want to access the settings click on the dashboard settings icon. It will open a new settings pop-up.
Yes, the dashboard data can be downloaded in Excel and PDF using the download button provided on the dashboard.
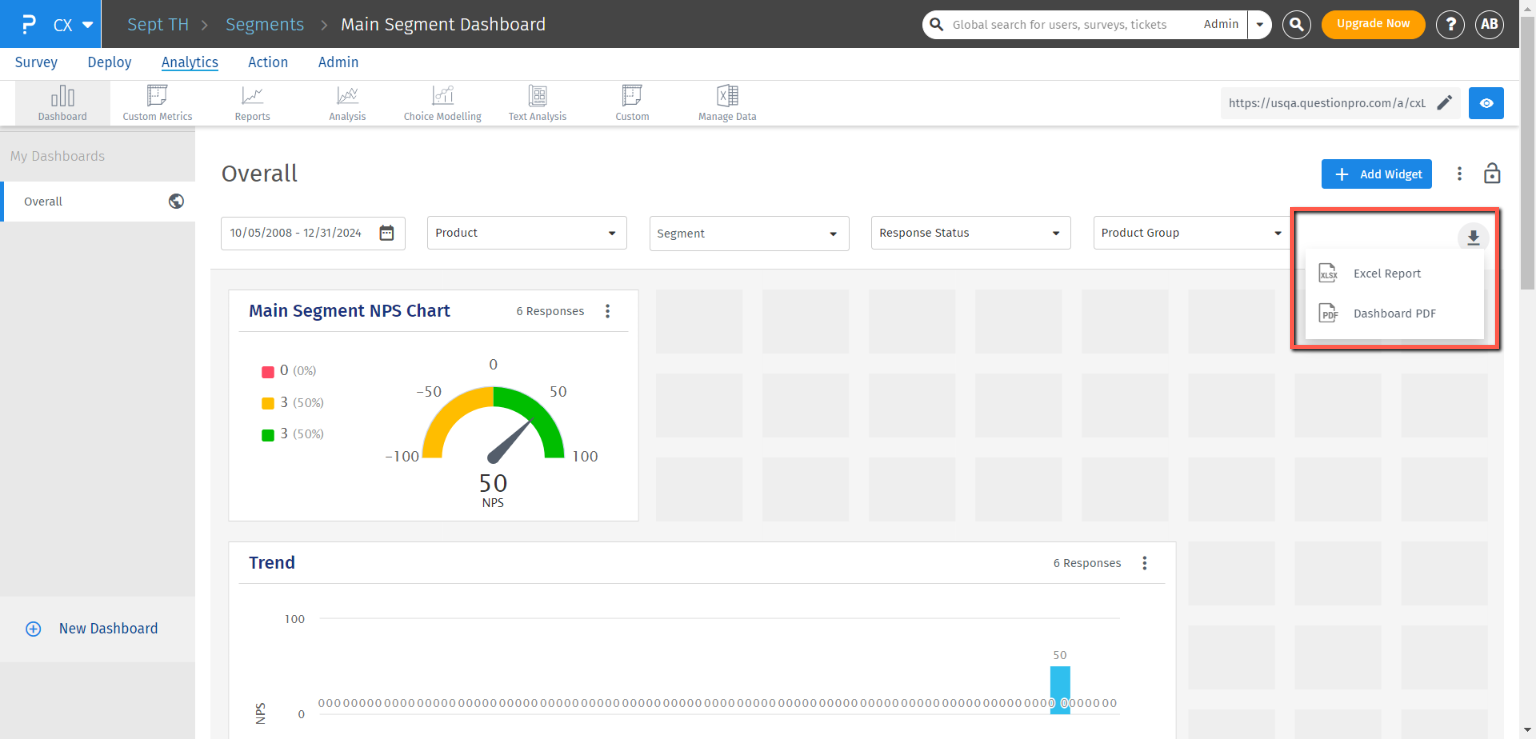
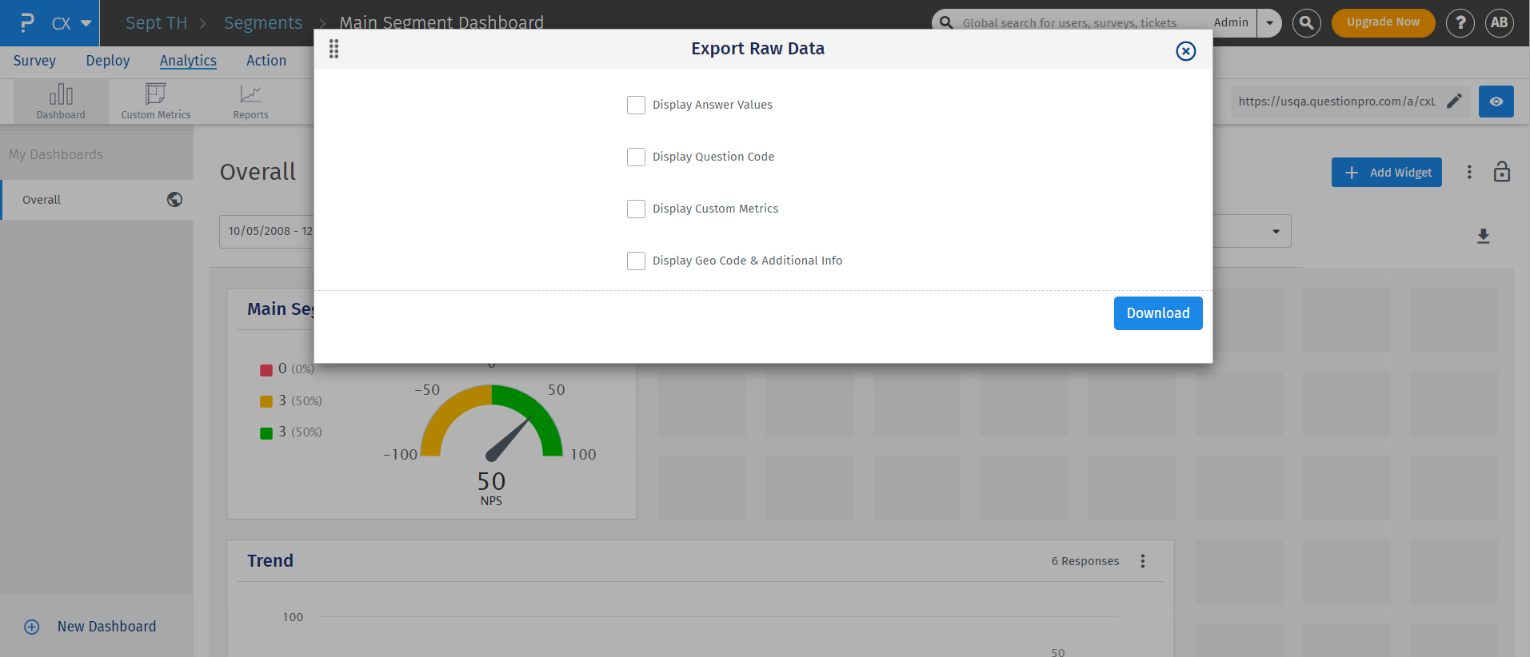
Excel Report option: Raw data related to the dashboard can be exported using this option. Once you click on Excel Report choose from the provided options as per your requirements and click on the Download button.
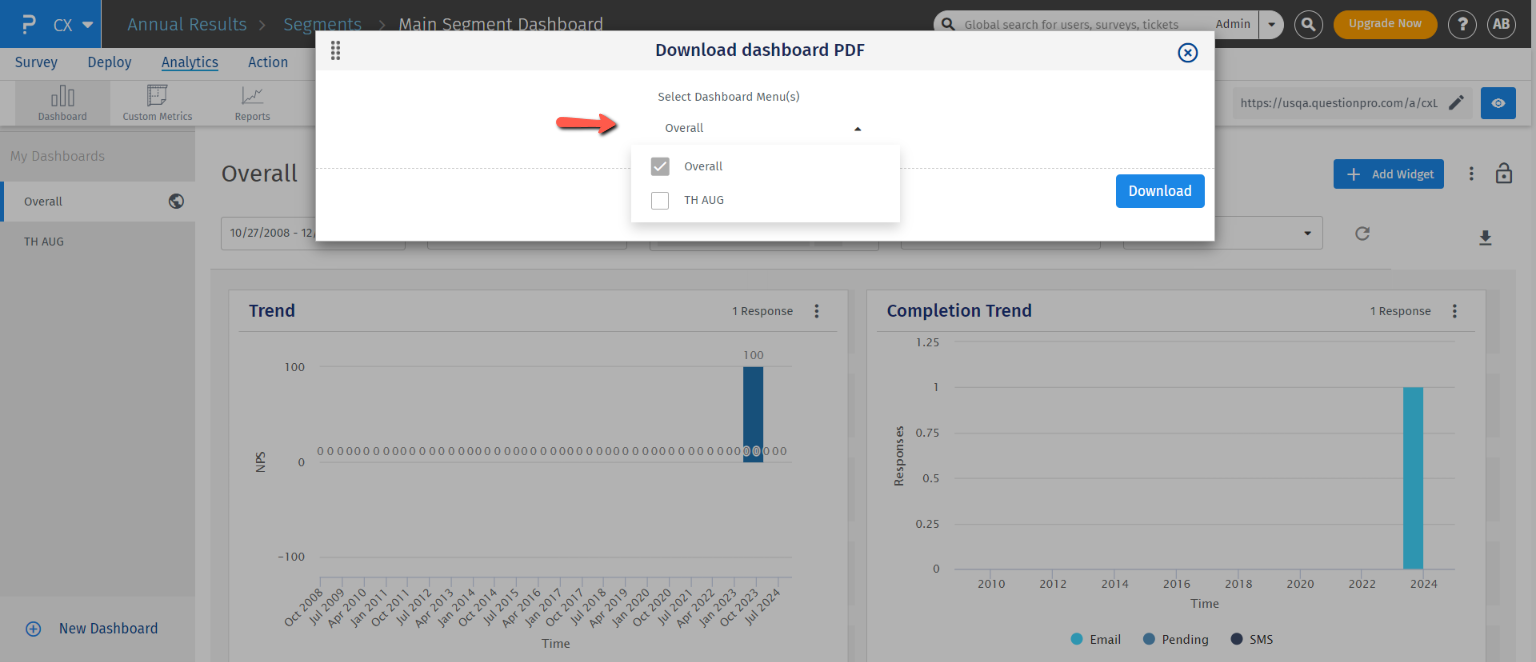
Dashboard PDF: Using this option all the dashboards and widgets can be downloaded in PDF. Once you click on the Dashboard PDF option, you can choose from all the available dashboards the dashboards which you want to download in PDF.
Once all the dashboards are chosen you can click on the Download button and it will download the dashboards in PDF.
By default, the dashboard section for filters will scroll with the dashboard. However, you can stick or lock the filters section on the top of the dashboard by using the Lock Filter's Section option represented by the lock icon in the right corner of the dashboard.
Once you click the lock icon, the filter's section will stick on the top and not move with the dashboard scroll movement.
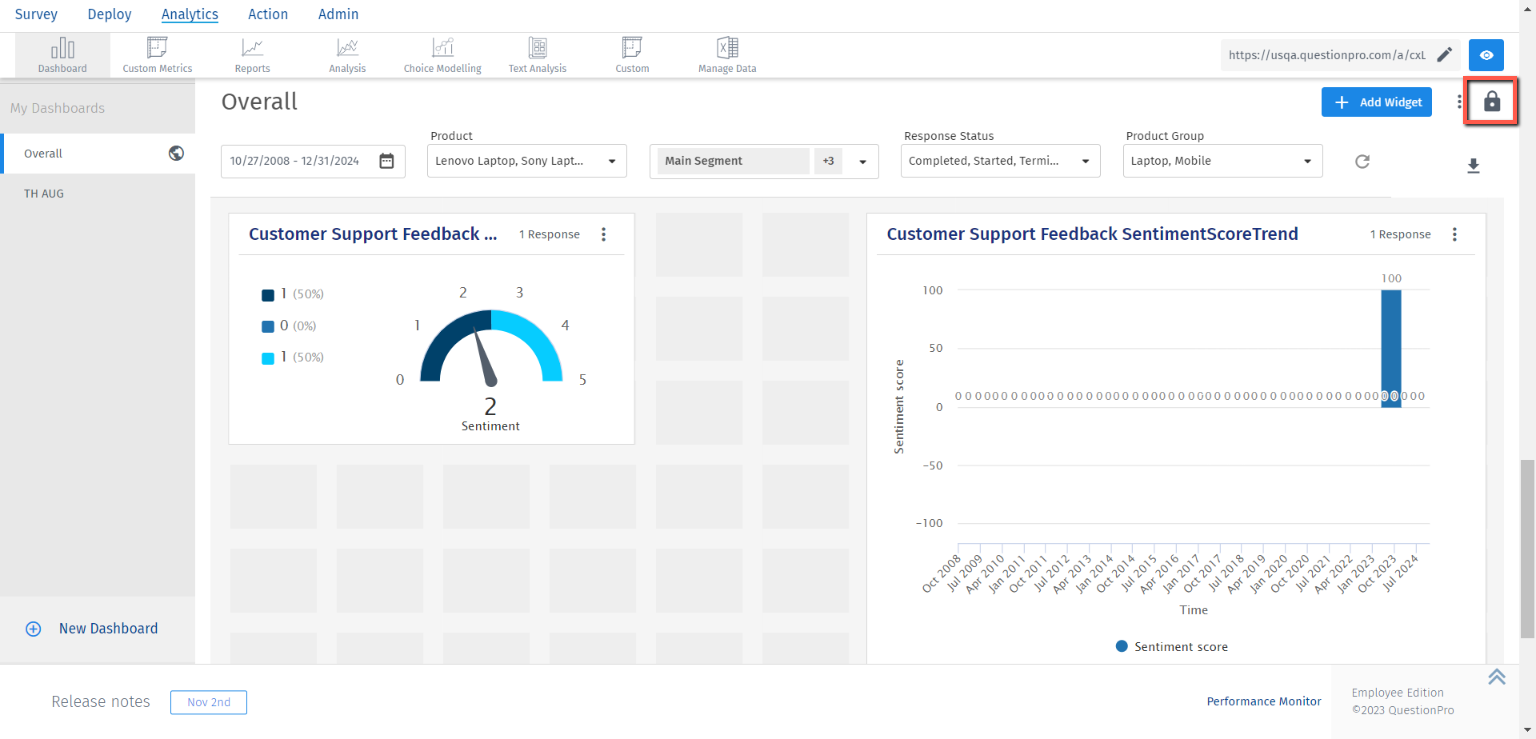 The same lock icon provided can be used to lock or unlock the filter's section on the dashboard.
Net Promoter Score is the primary metrics used to measure the experience of a customer. Being able to set a target score or benchmark within the organization and use that to compare the actual NPS is what QuestionPro benchmarking is aiming at. With NPS benchmark, you can set a target score across the Workspace and the dashboard will give you a comparison with the actual benchmark to help you understand where you are lying with respect to the target score and how much is the improvement scope.
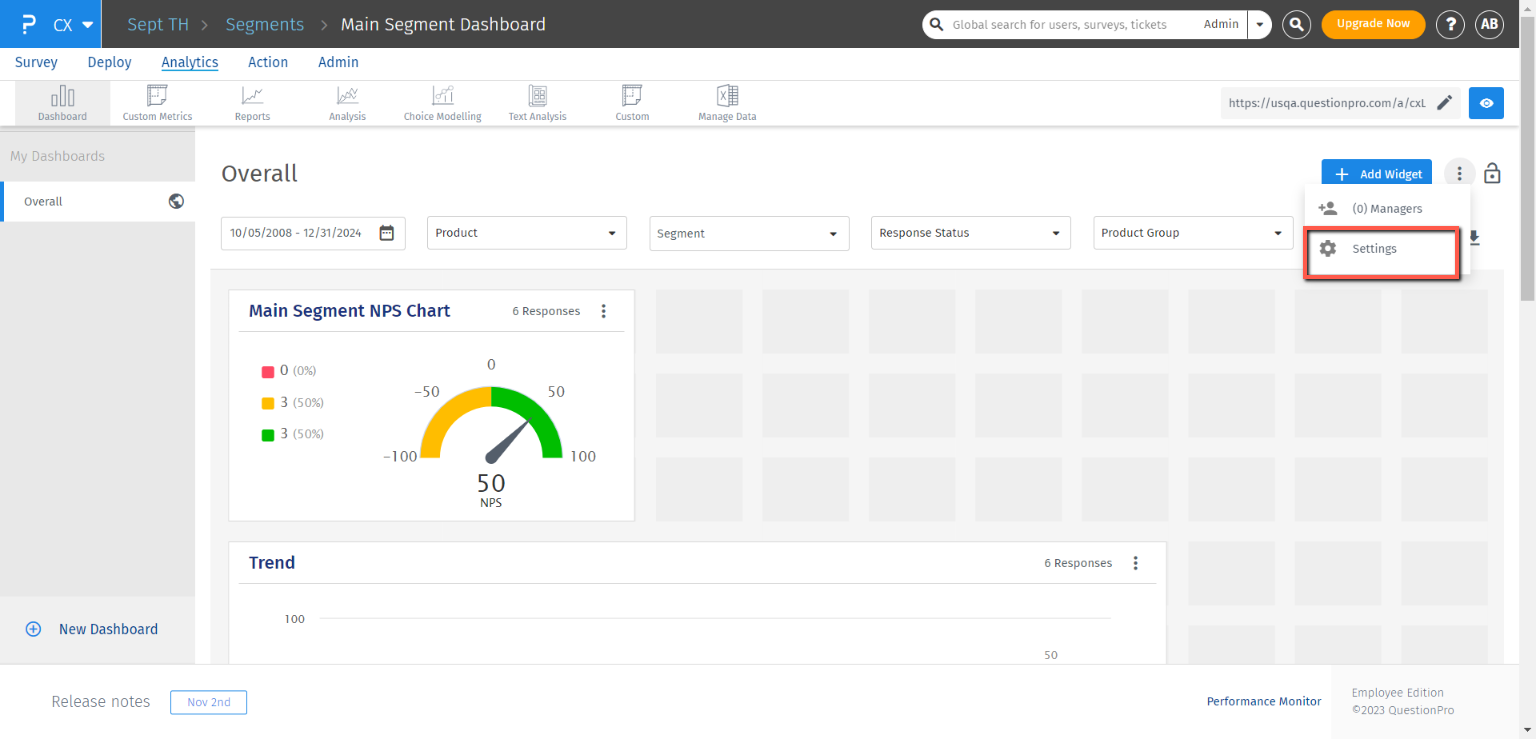
You can set the benchmark score for a Workspace by following below steps:
- Go to Login » Customer Experience » Analytics » Dashboard
- Open Settings
- Set a score between -100 to 100 against NPS Benchmark
- Save the settings
- The benchmark will be applied to all the widgets which displays NPS
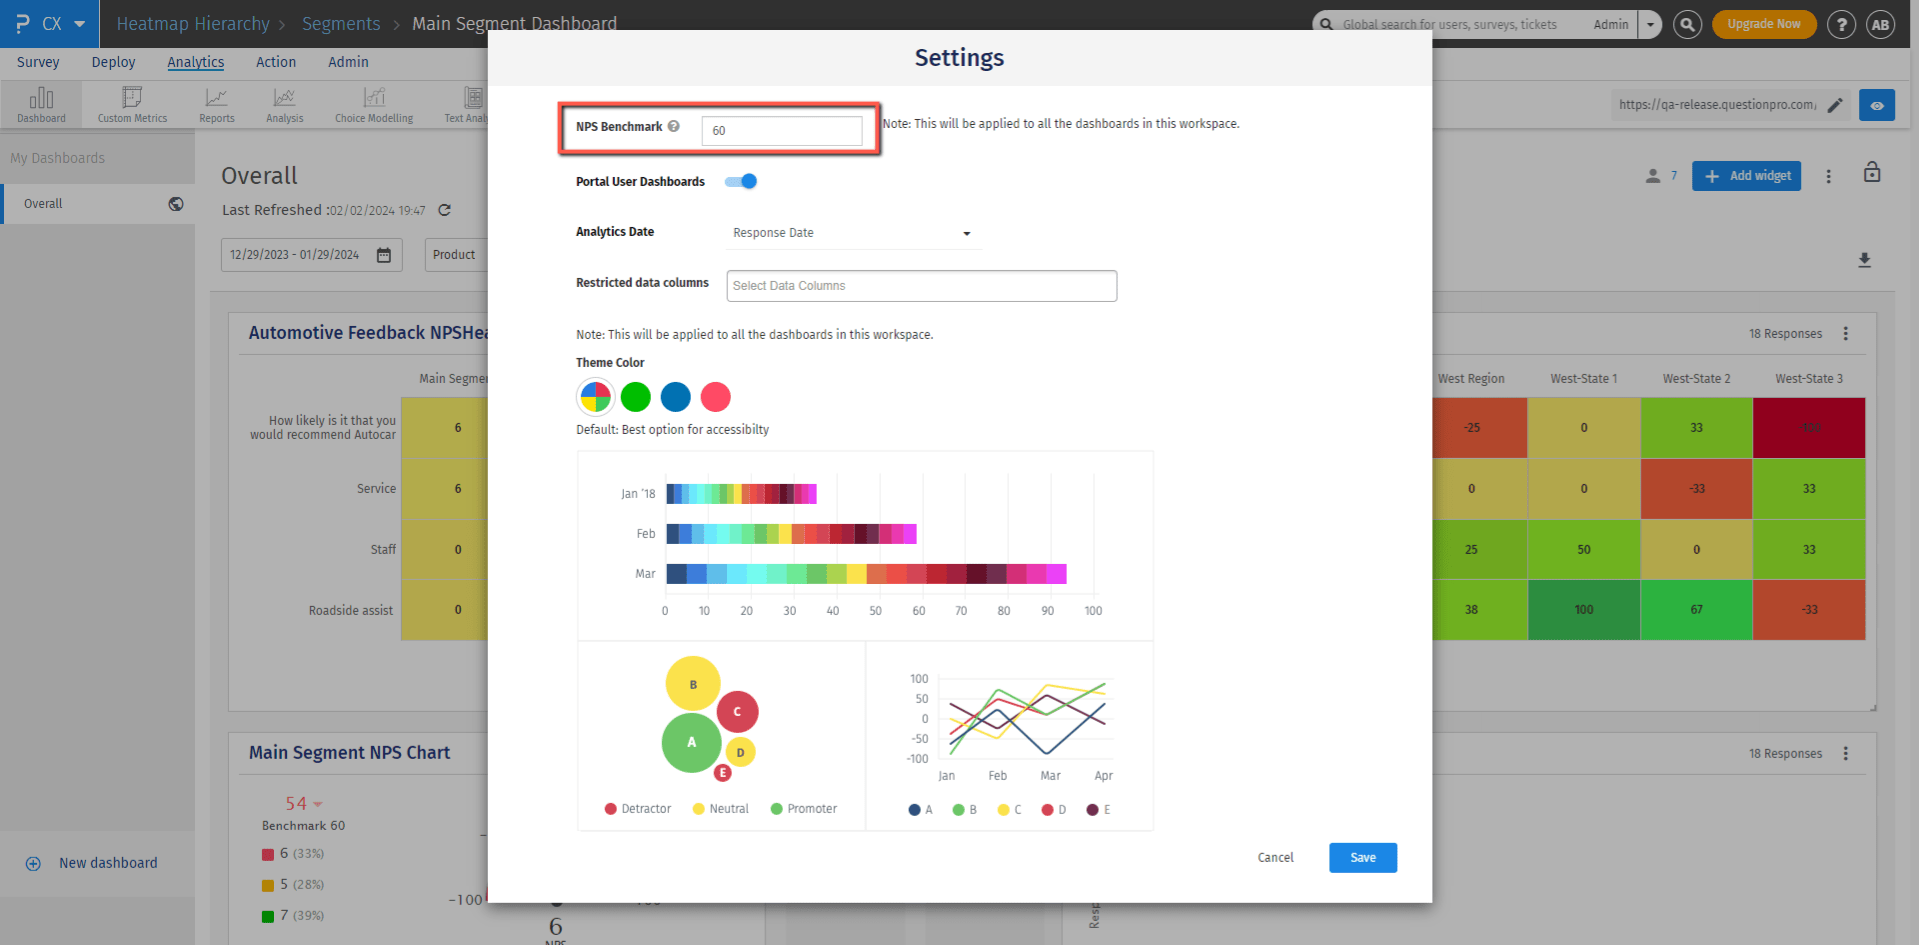
Below are the widgets which support benchmarking:
- NPS Widget
- NPS Trend
- NPS list
- NPS Trend Comparison
- Heatmap Analysis
- Priority matrix
Yes! Absoultely! Access to a dashboards can be restricted to the managers by using the setting "Portal User Dashboards" available at each dashboard. Turning off this toggle will disable access to the corresponding dashboard for the managers.
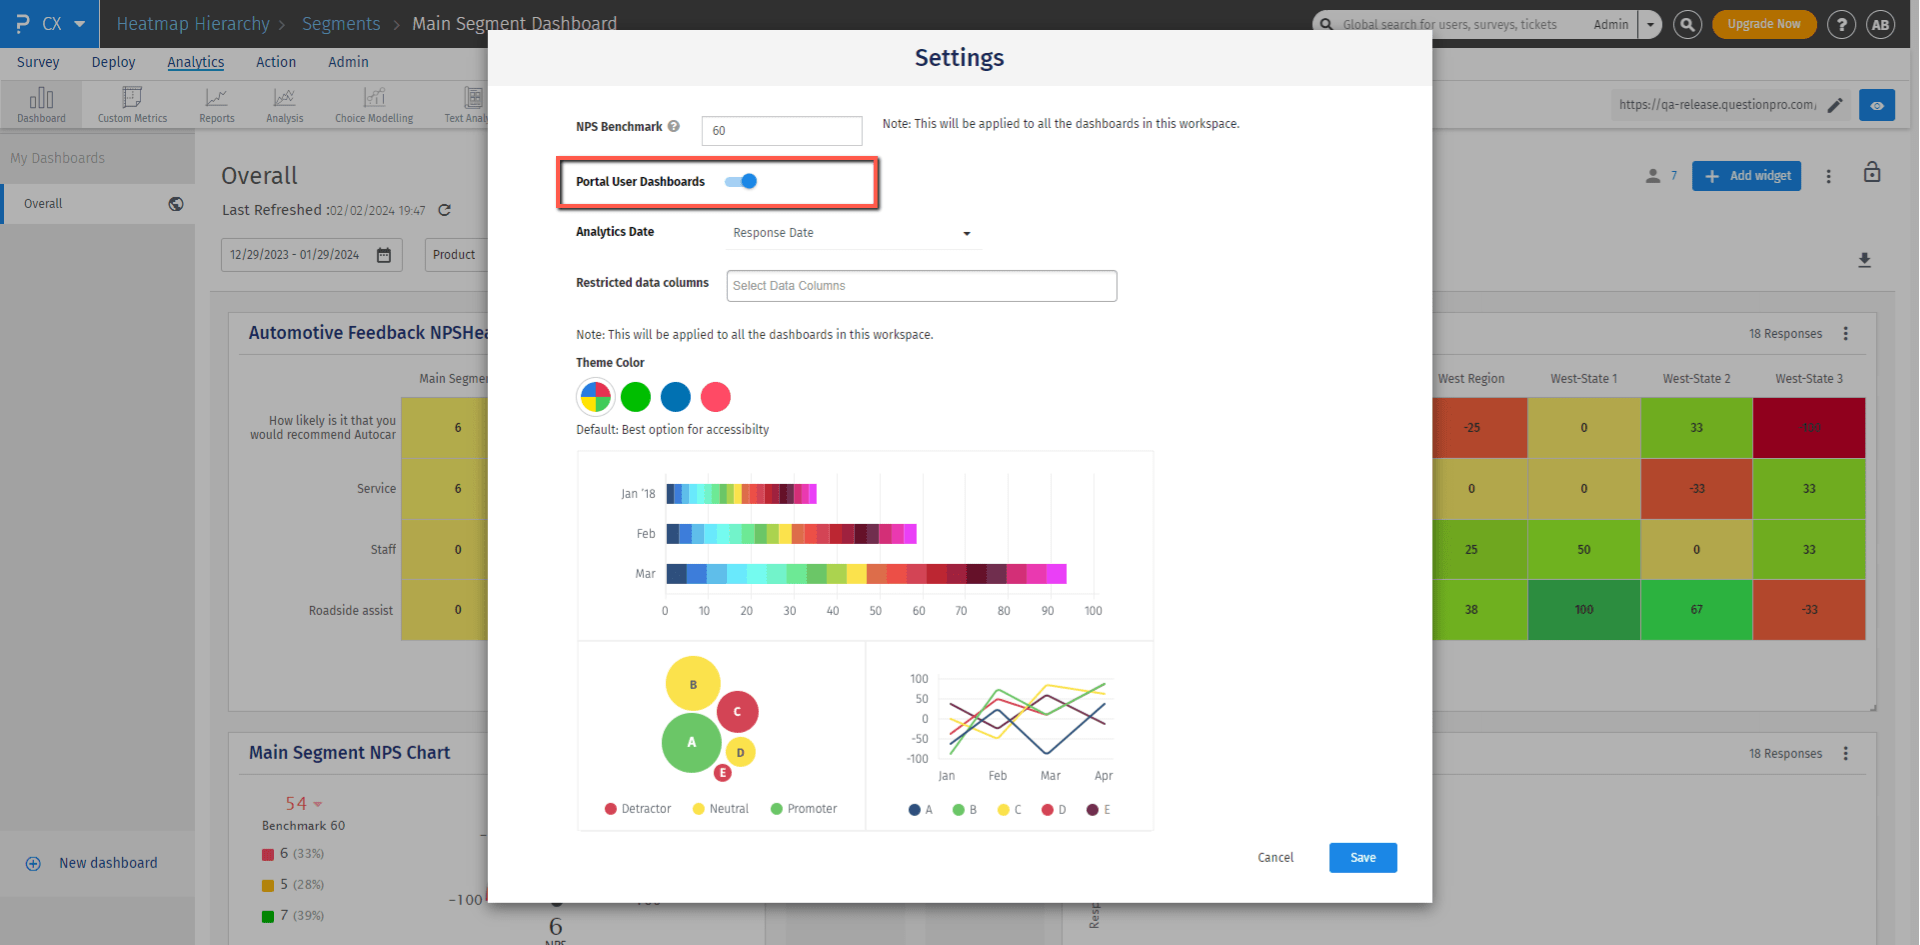
With this enhancement, you now have the option to choose from three distinct date sources for your computations:
- Import Date: Use the "Import Date" option to base your calculations on the date when data was imported into the system. This is particularly useful when analyzing historical data and tracking trends over time.
- Transaction Date: Opt for the "Transaction Date" option to perform computations based on the date of the actual customer interaction or transaction. This is ideal for real-time analysis and gaining insights into current customer behaviors.
- Response Date: Select the "Response Date" option to focus on the date when customer surveys were completed. This is invaluable when evaluating customer feedback and understanding their sentiments at specific points in time.
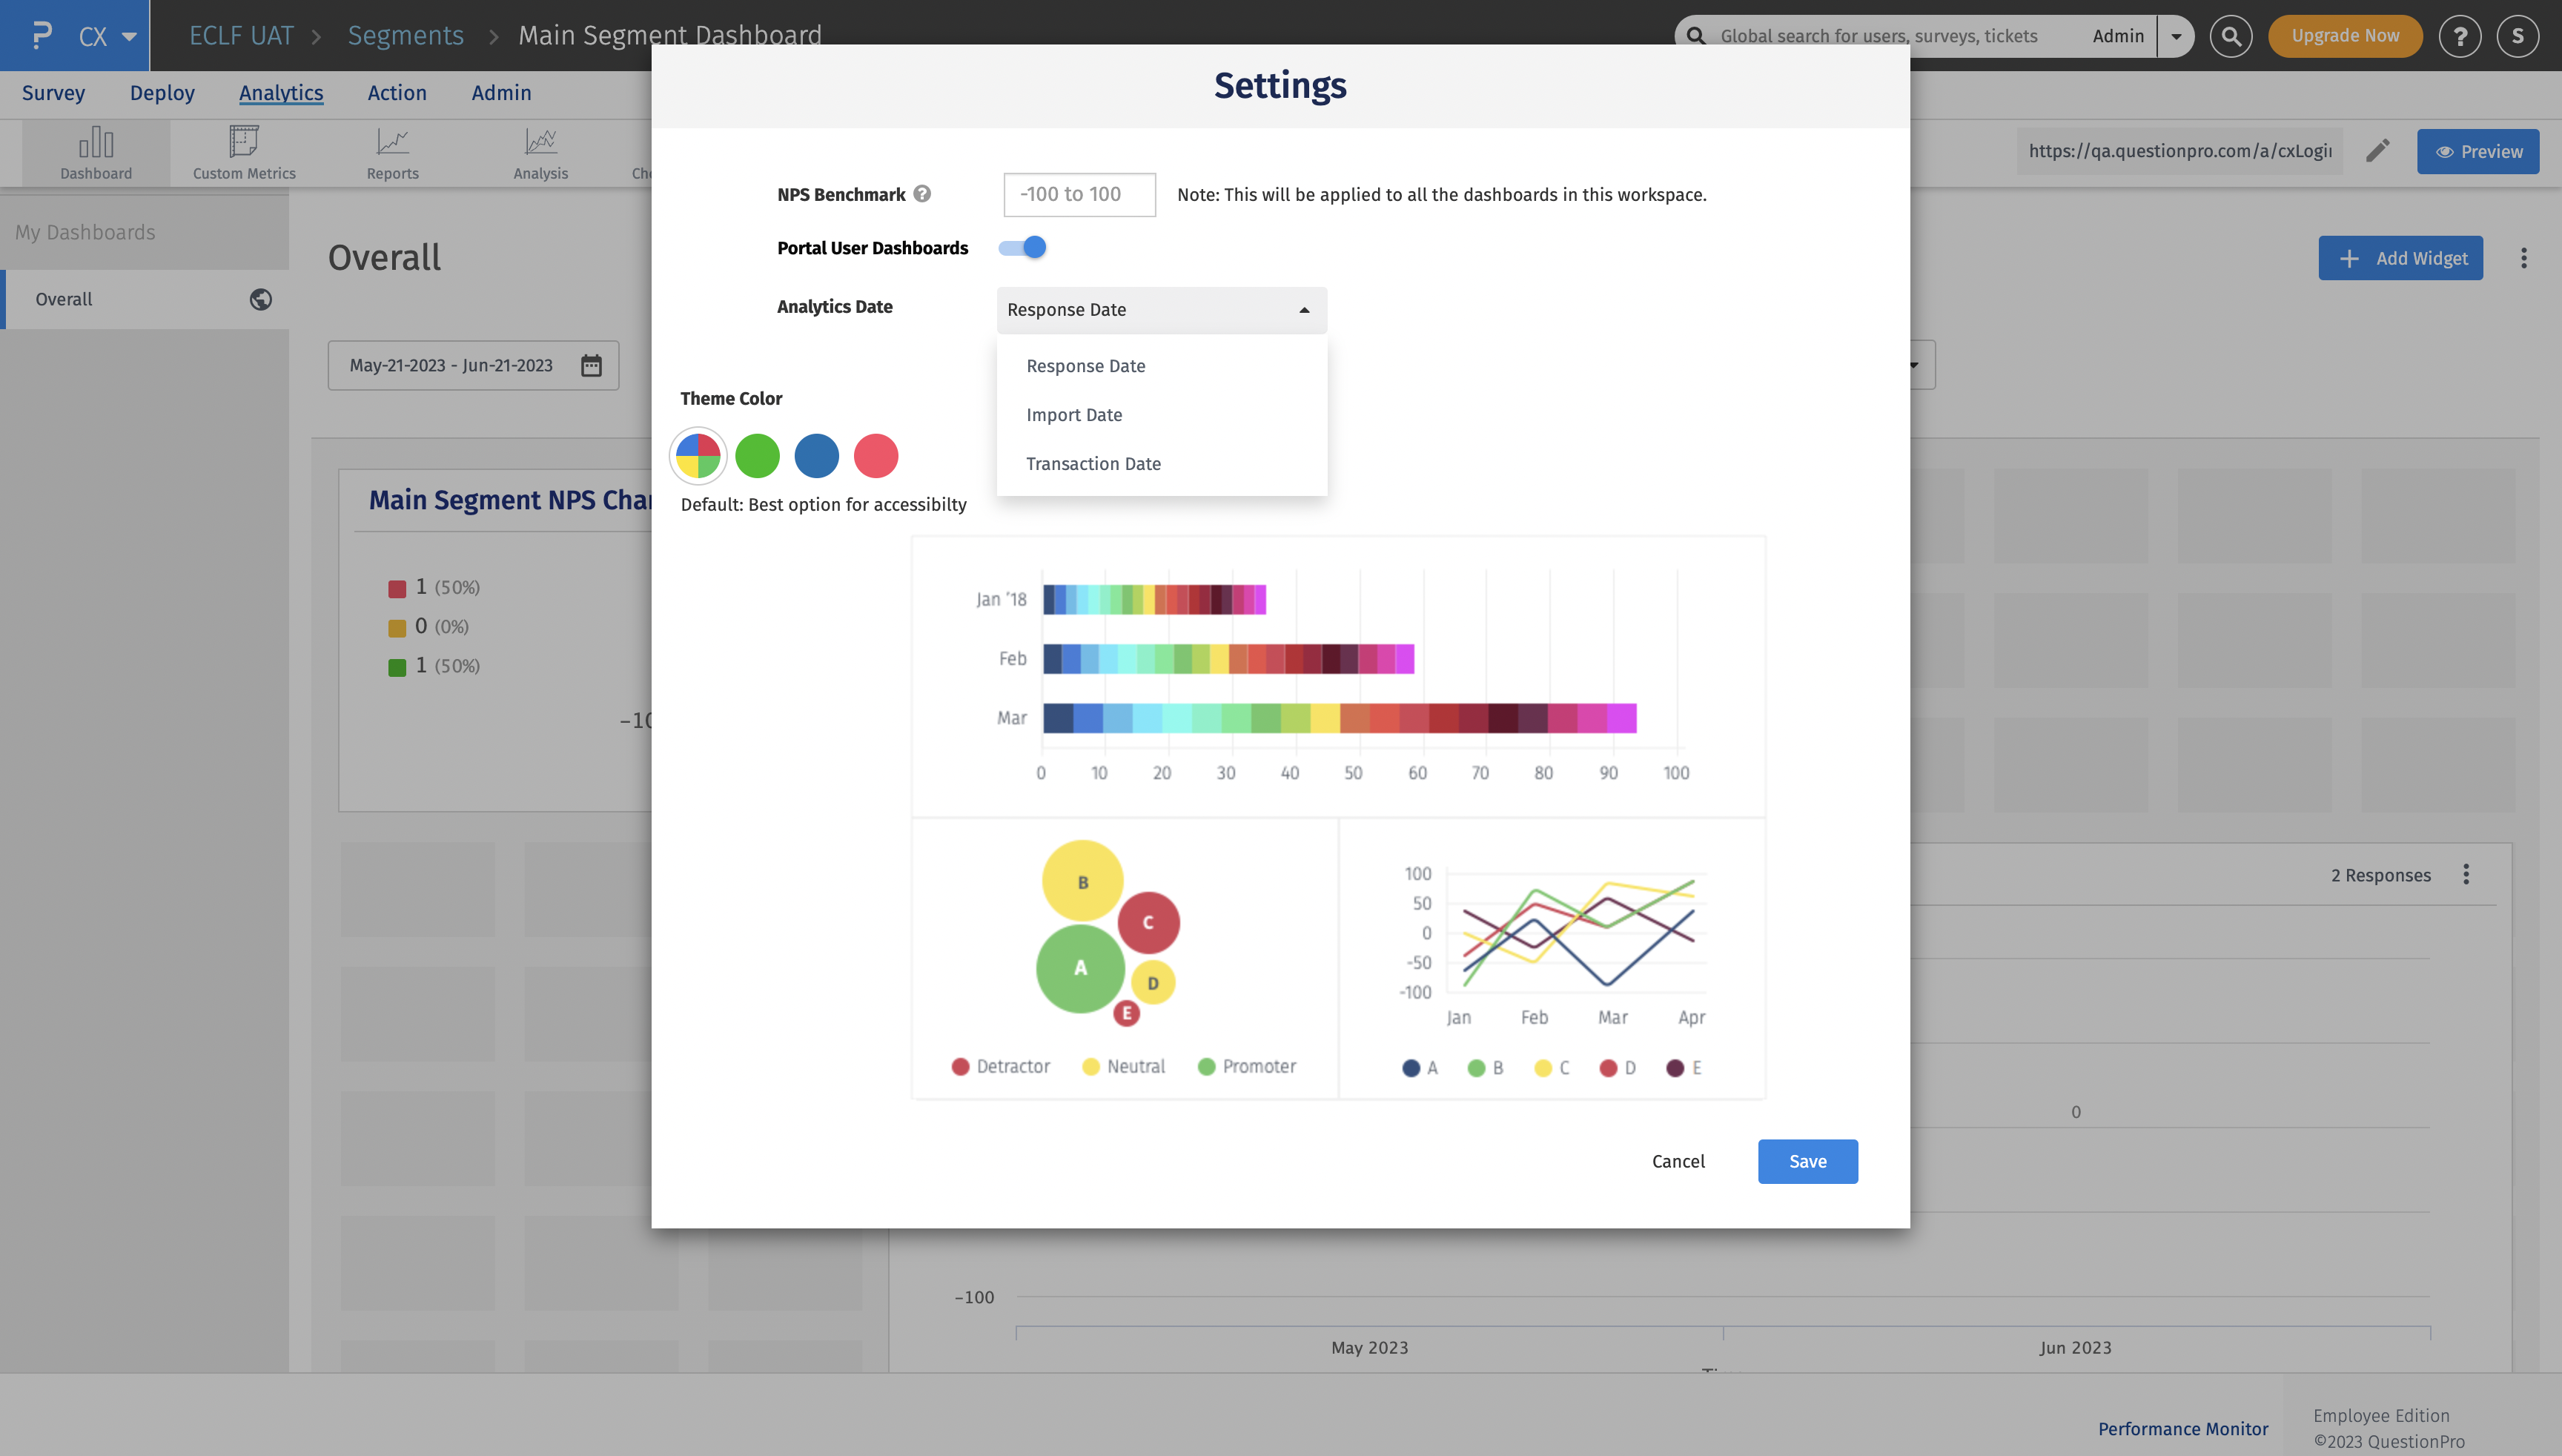
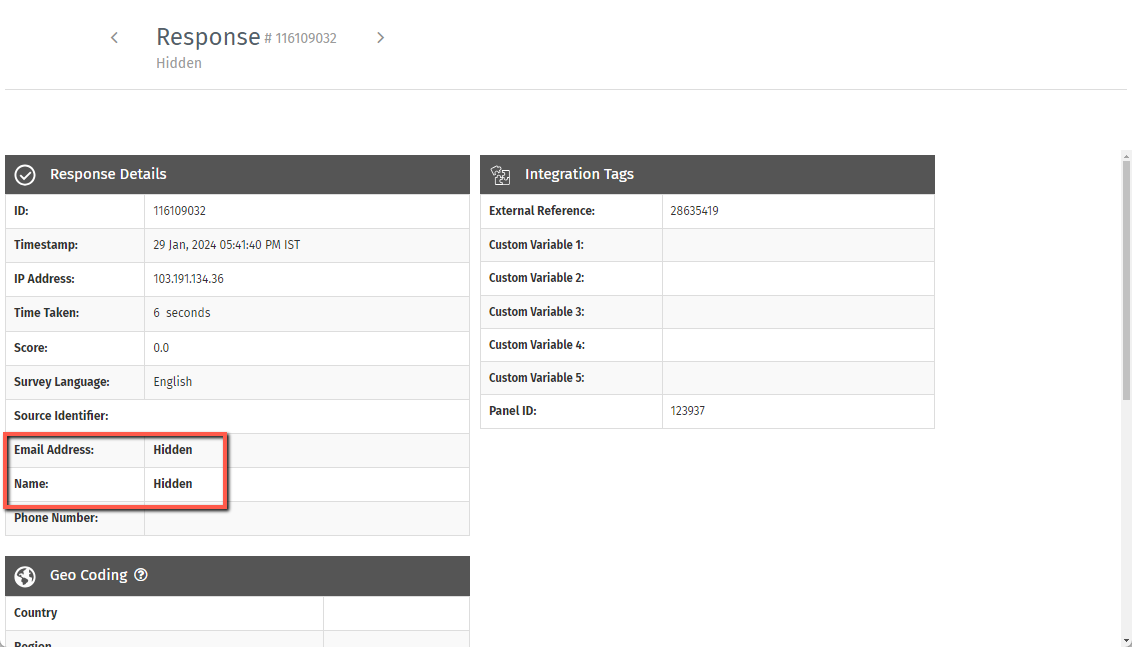
Yes! You can choose all the data columns in the “Restricted data columns” dropdown which you want to restrict from managers to be viewed and accessed in detail. All the data columns selected here will be restricted and managers will not be able to view them in the dashboards shared with them.
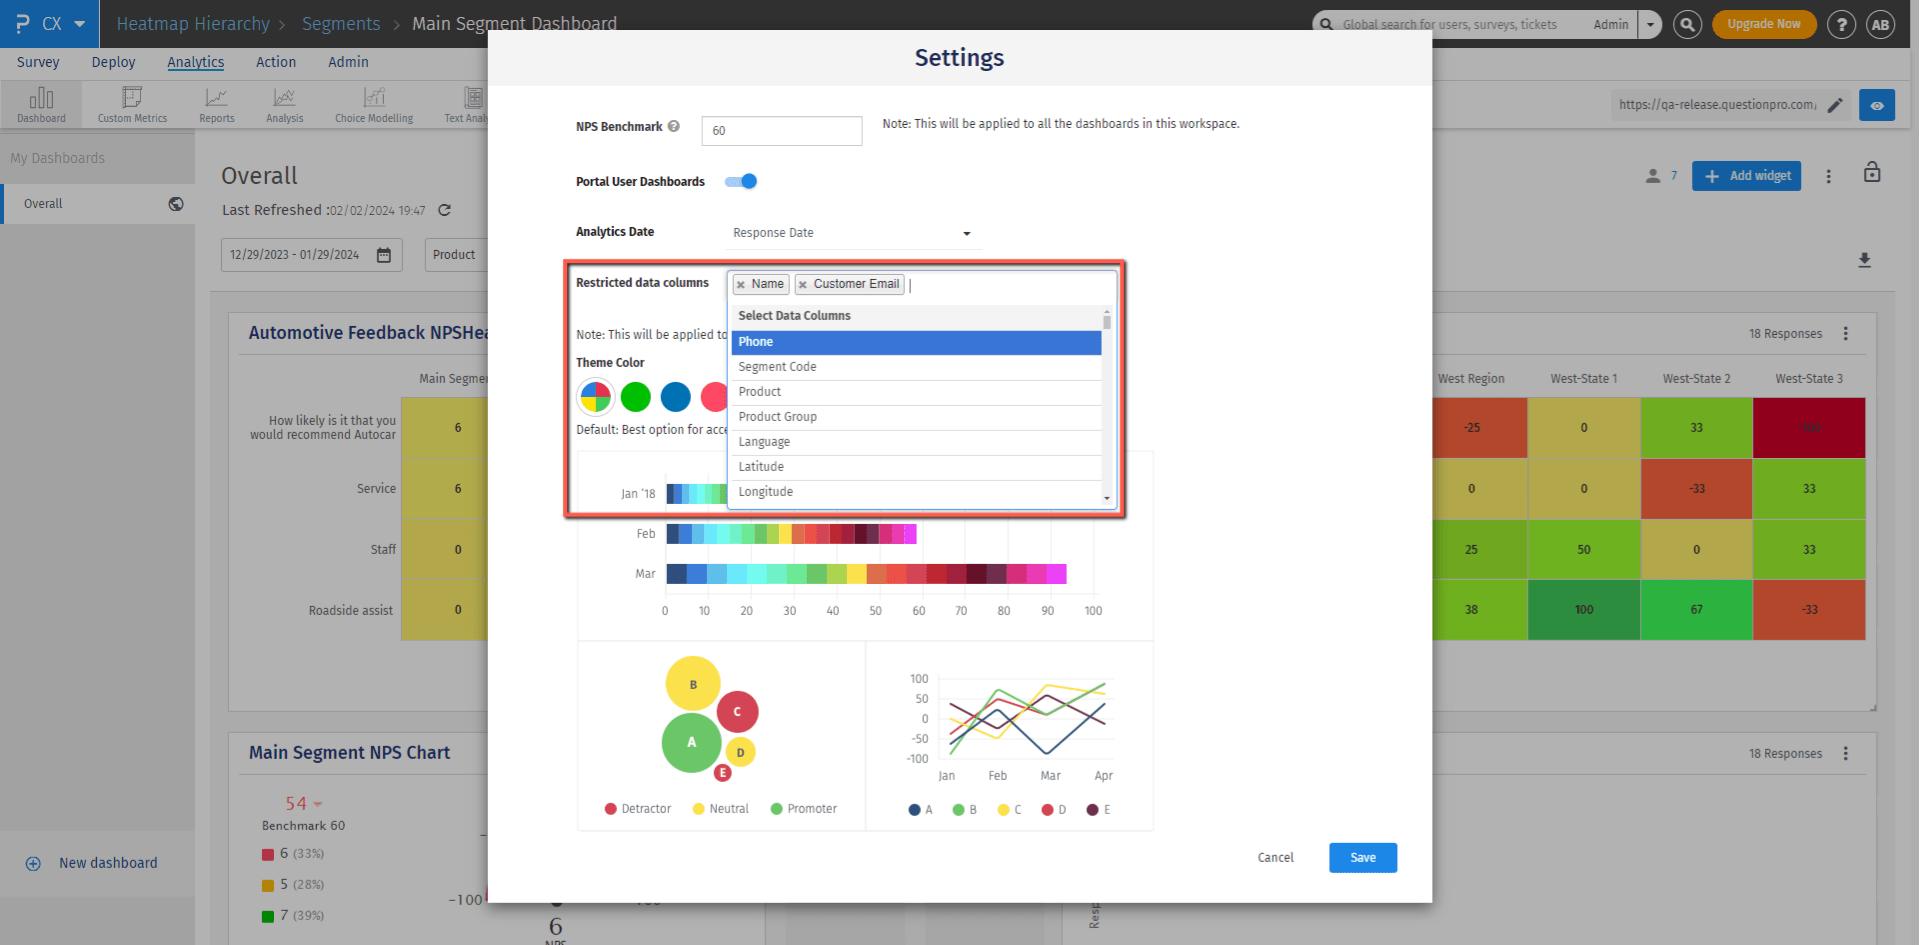 When the response viewer is opened by clicking on a widget, the restricted fields will be shown as “Hidden” to the managers.
