

- Custom Variable Widget
- Priority Matrix
- Heatmap Widget
- Grid Widget
- Weighted mean widget
- Comment List widget
- Widget Filters
- Ranking List Widget
- Distribution Chart
- NPS Widget
- Trend Widget
- Word Cloud Widget
- Cross tab widget
- KPI Comparison Widget
- Bubble chart
- Custom Metric Trend Chart
- Trend Comparison Widget

Trend Comparison Widget
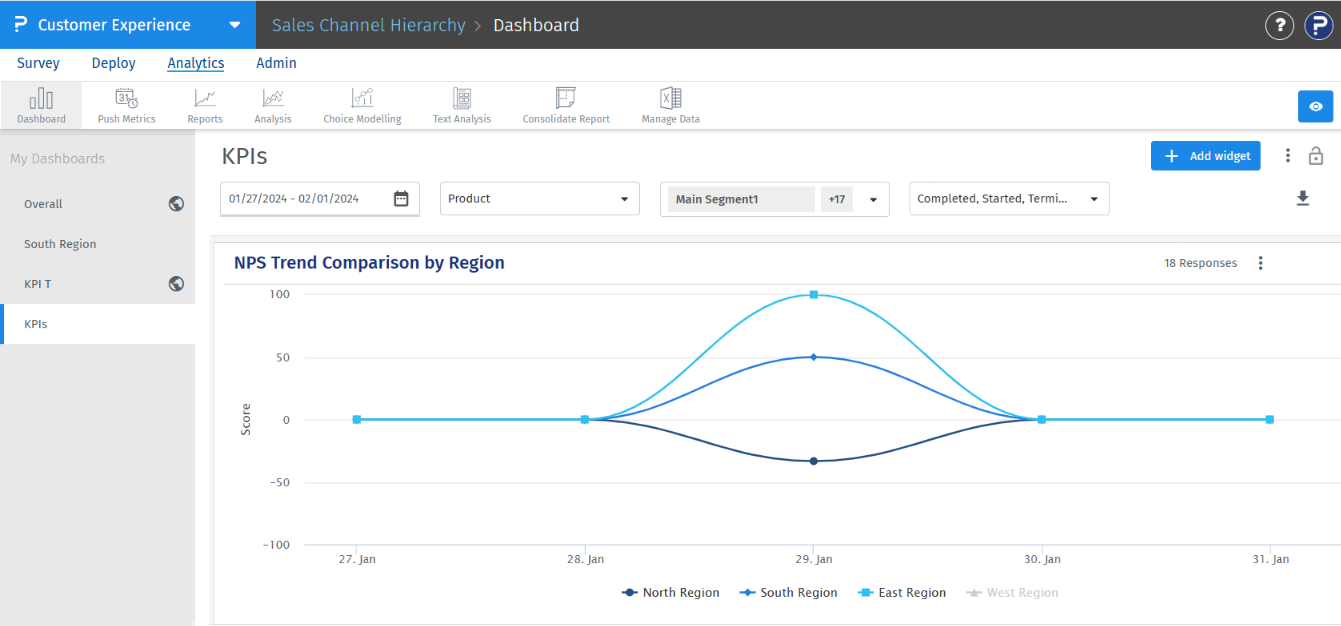
The Trend Comparison Widget enables you to visualize and compare KPI trends over a selected time period. This widget is ideal for analyzing trends across different segments, products, product groups, or custom variables. It supports two scoring models for comparison: NPS (Net Promoter Score) and CSAT (Customer Satisfaction Score).
Please note that this is a segment-level widget.
Adding a Trend Comparison Widget
To add a Trend Comparison Widget to your dashboard:
- Navigate to the desired workspace dashboard.
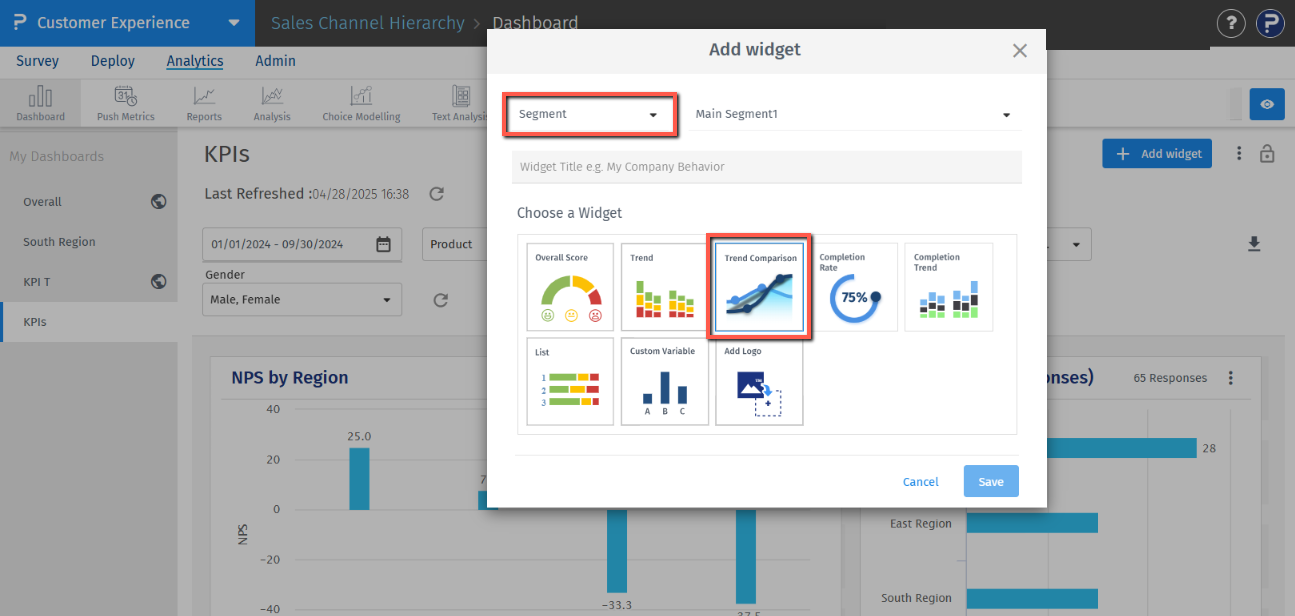
- Click the "+ Add widget" button.

- From the dropdown, select "Segment Types Widget", and then choose "Trend Comparison Widget".
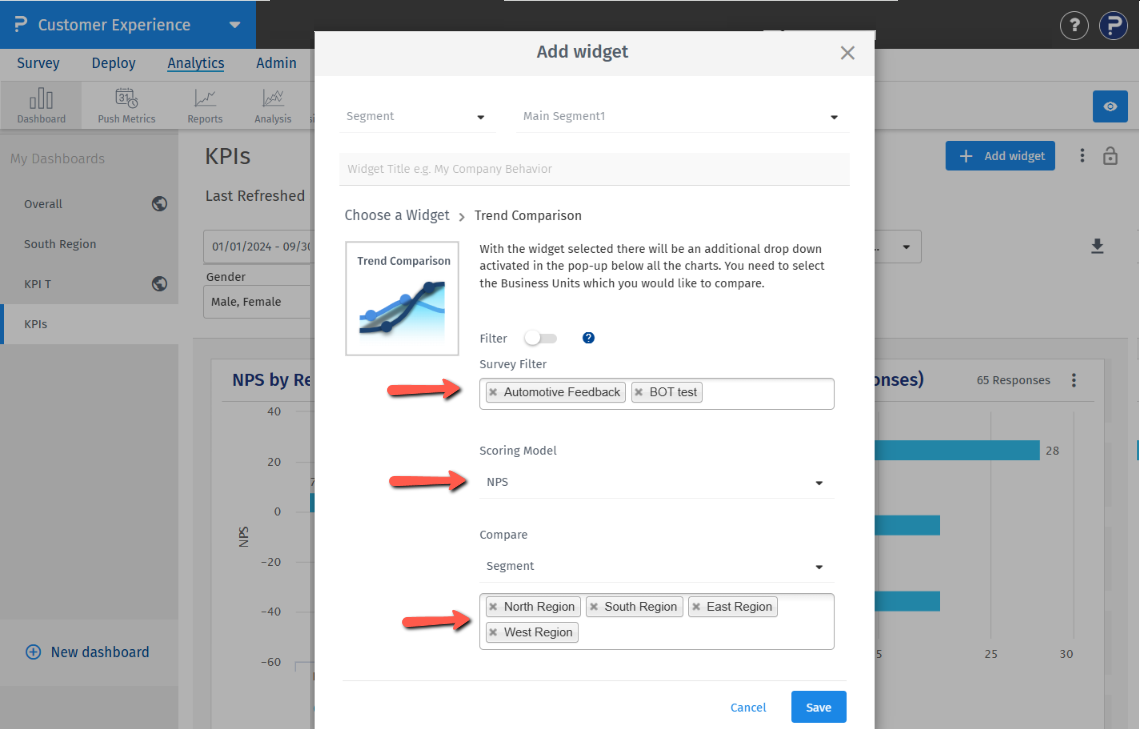
- On the next screen, select the relevant surveys, scoring model (NPS or CSAT), and the entities you want to compare (e.g., products, product groups, segments, or custom variables).
- Click "Save" to add the widget to your dashboard.
Widget Settings
- Scoring Model: Toggle between NPS and CSAT based on your reporting needs.
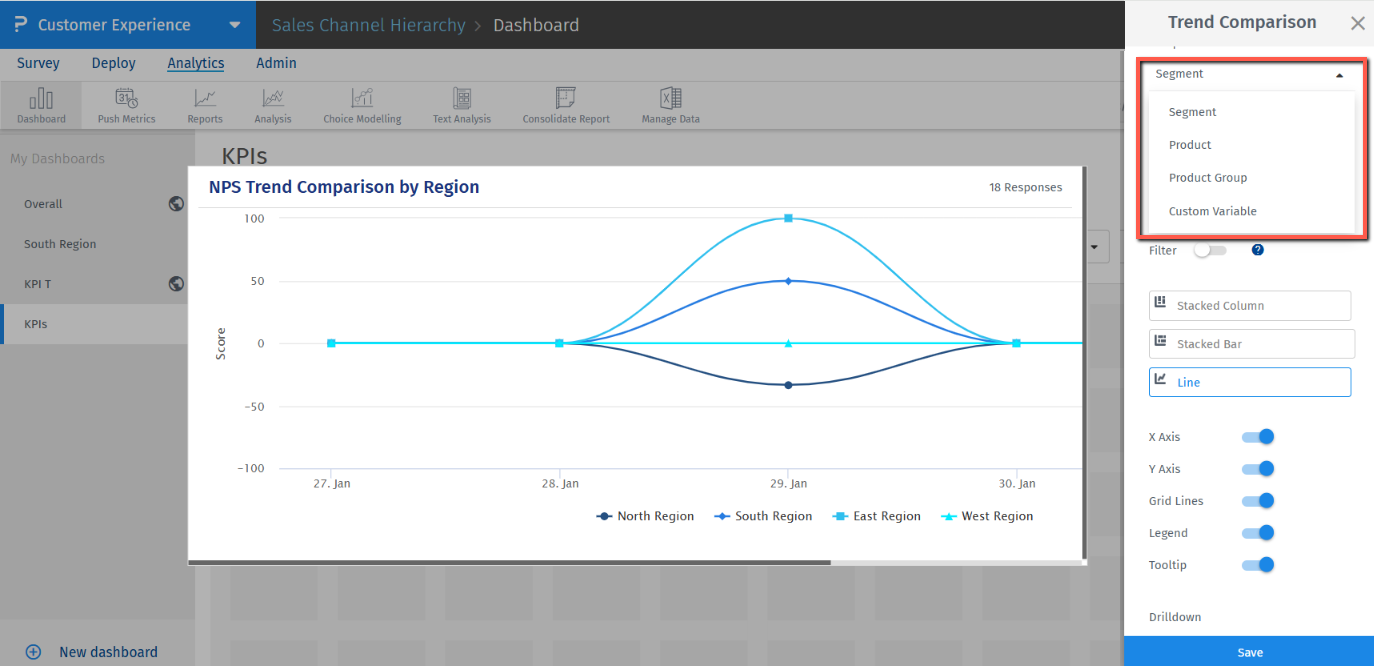
- Compare By: Choose the dimension for comparison—Segment, Product, Product Group, or Custom Variable. You can also update or add comparison entities using the dropdown provided.
Supported Chart Types
The Trend Comparison Widget supports the following chart types:
- Stacked Column Chart
- Stacked Bar Chart
- Line Chart
These visualization options allow for flexible and clear trend comparisons based on your selected parameters.
You may also be interested in...