

- Community Settings
- Survey Opt-Out for Members
- Security
- Facebook setup
- LinkedIn setup
- Google setup
- Twitch setup
- Social login
- Mobile app - privacy policy
- HMAC
- External passback
- Google Analytics
- Survey swipe
- Communities Authentication - SAML SSO
- Merge all Pending Surveys
- Regional Sign Ups
- User Roles and Permissions
- Data Sharing Options
- Login Authentication
- Global community member profile
- Profiling surveys
- Default surveys
- Global community profile - settings
- Hidden field
- Move profile fields
- Profile fields - survey integration
- Profile sync
- Confidence score
- Import Profile Data
- Profile Groups
- Default Surveys 2.0
- Profiling Surveys 2.0
- Member Profile Fields 2.0

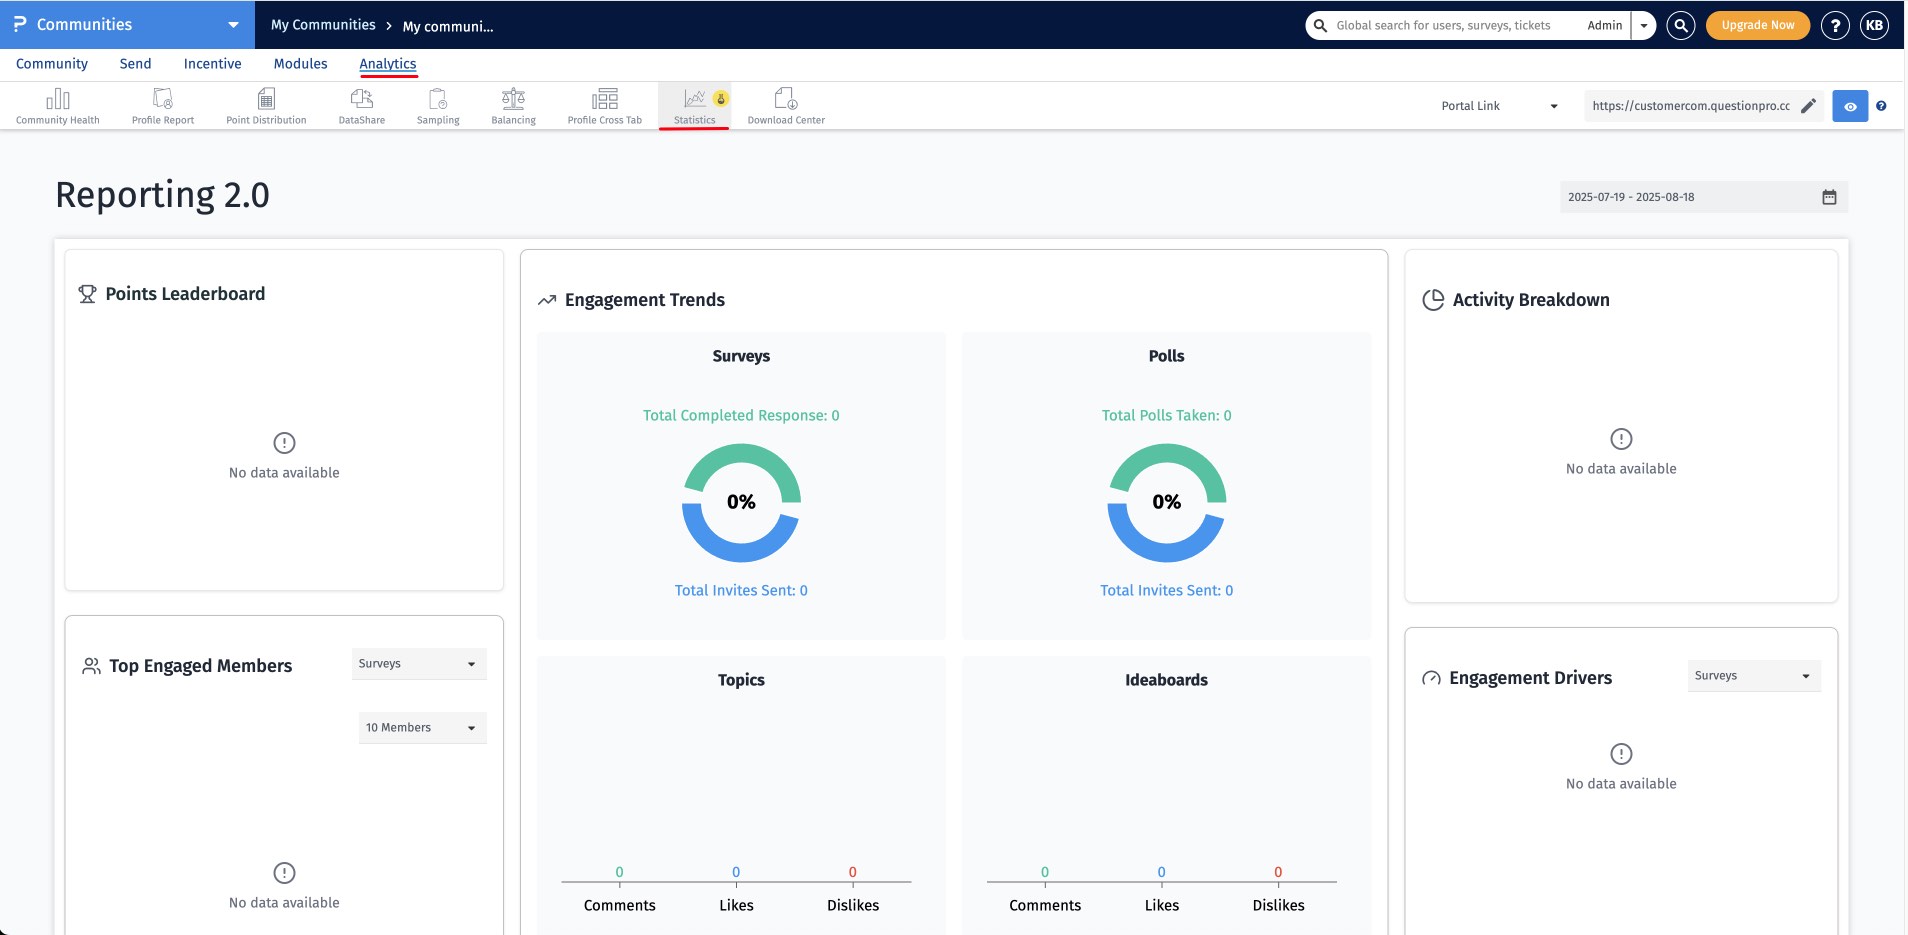
Community Statistics
Click to download the video
To access community statistics, simply navigate to: Analytics » Statistics
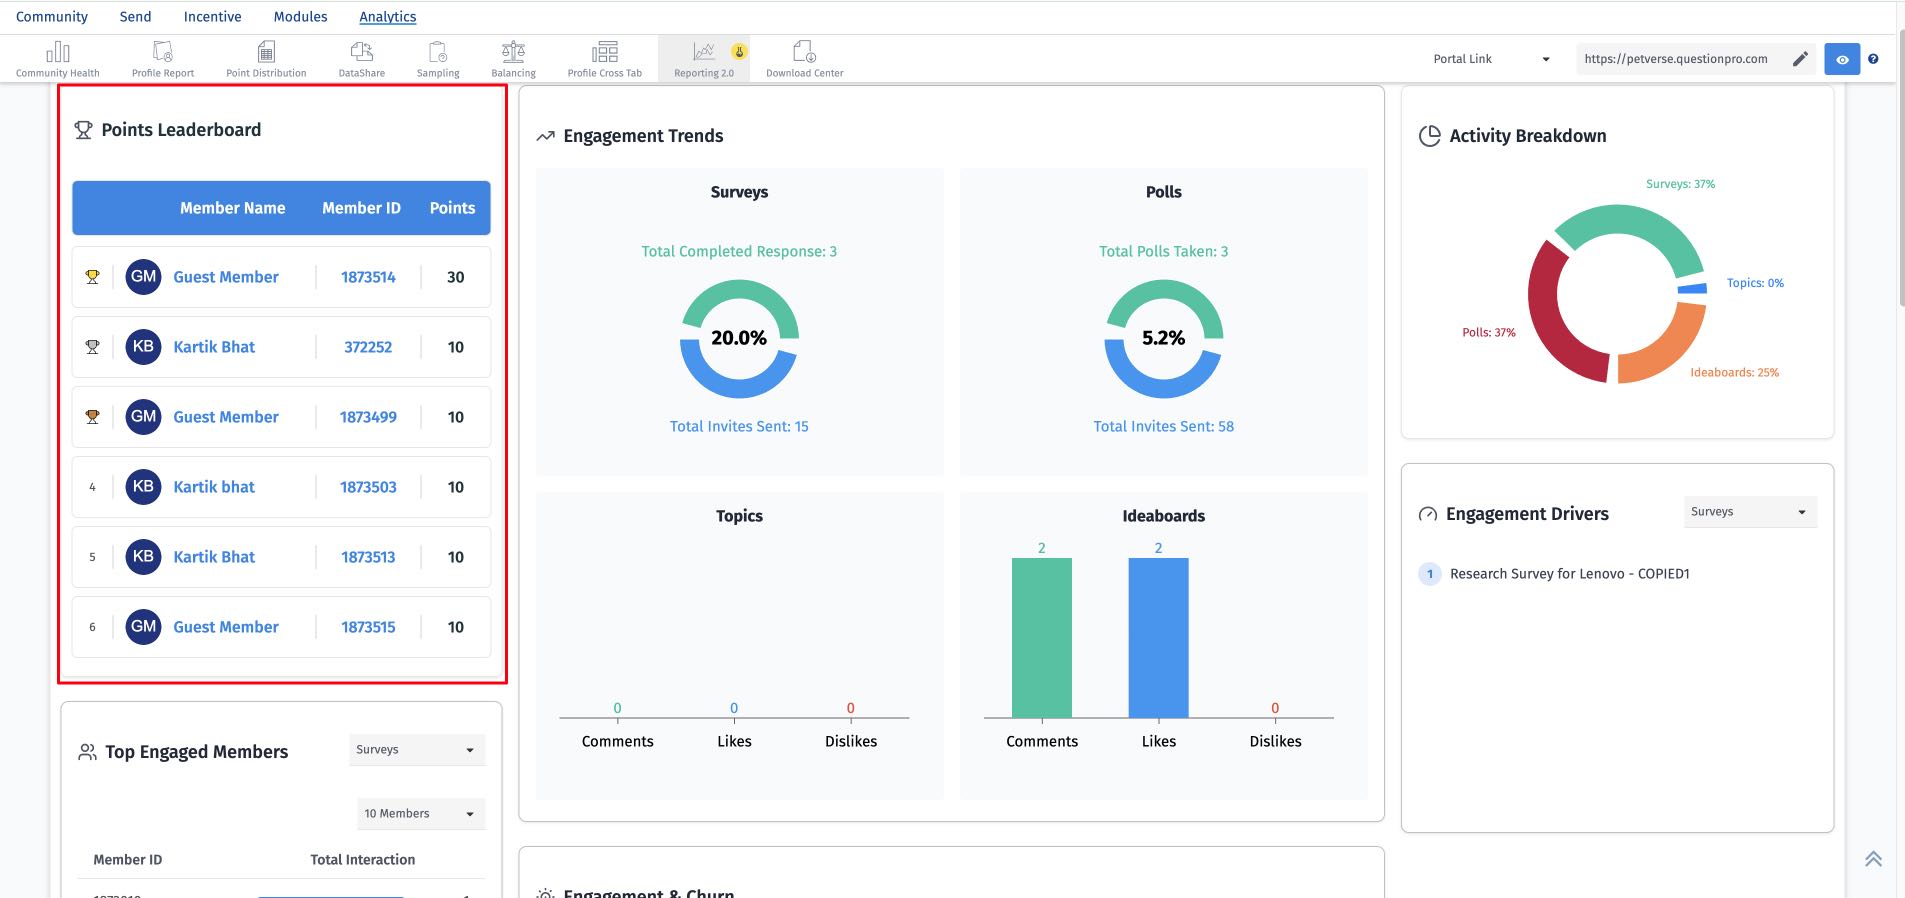
The points leaderboard card highlights the members who have earned the highest number of points within the selected timeframe. This allows you to quickly identify and recognize your most active and contributing members.
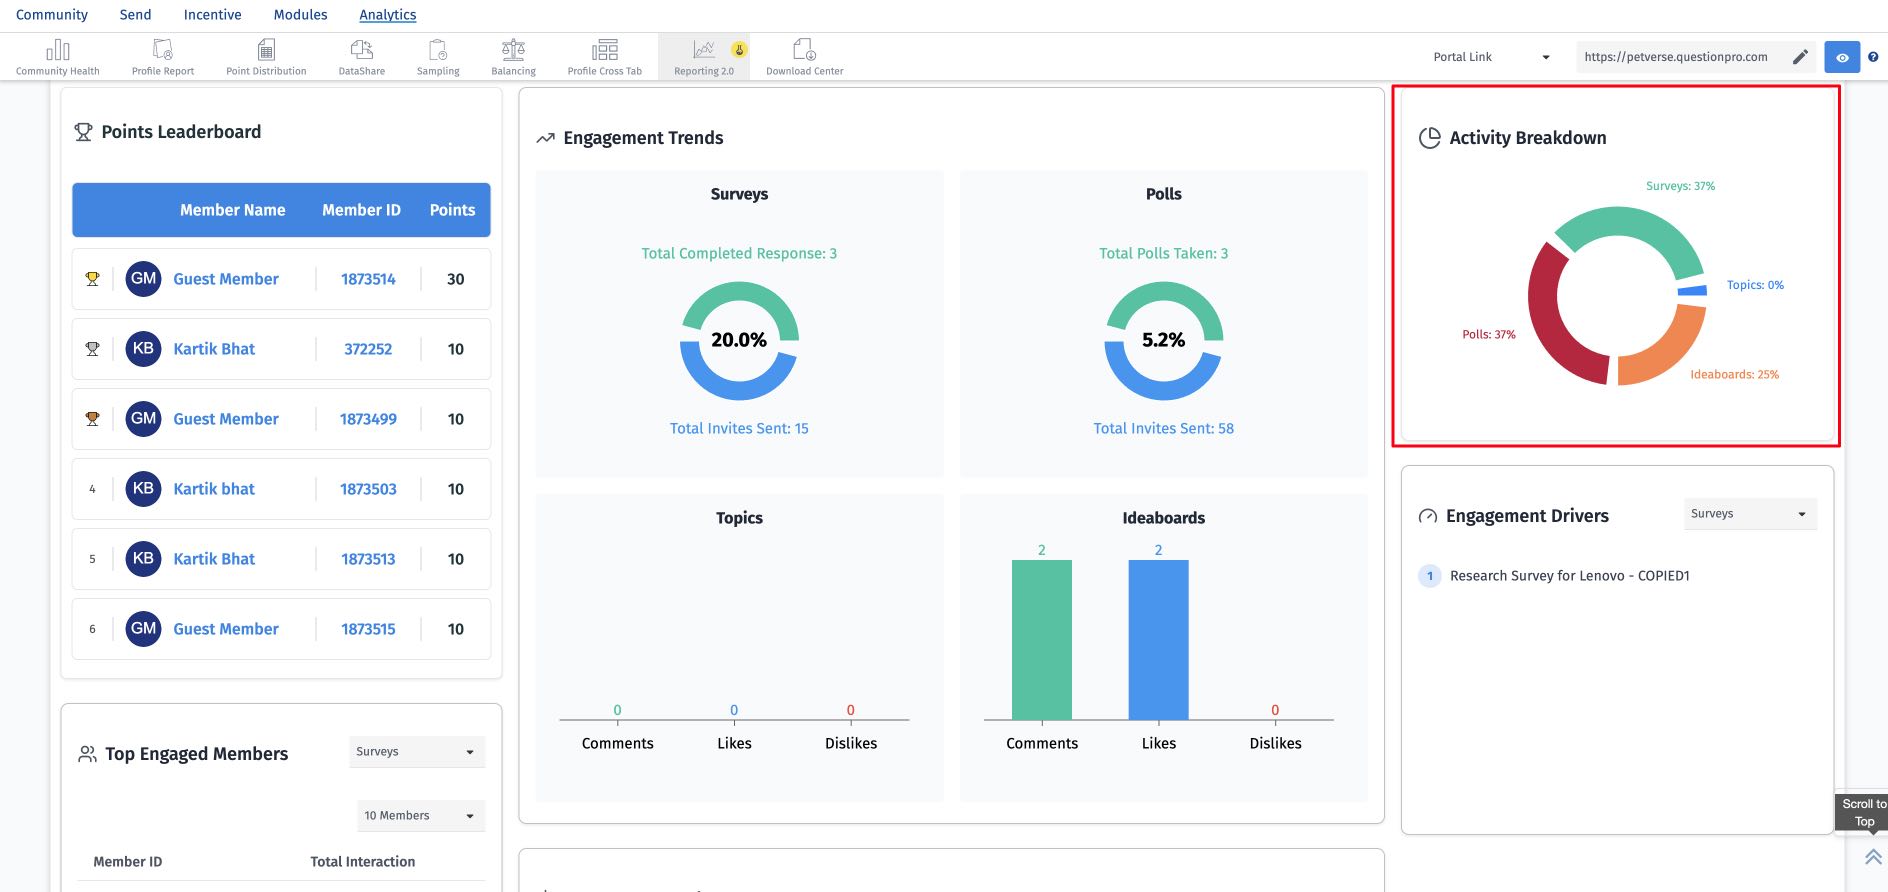
This view displays the distribution of community engagement across different activities, such as surveys, polls, topics, and idea boards. It helps you understand which activities are driving the most participation within your community.
The Engagement Trends feature offers an overview of how different areas of your community are performing. It provides insights into activities such as surveys, polls, discussion topics, and idea boards, helping you identify which areas drive the most participation and where improvements may be needed.
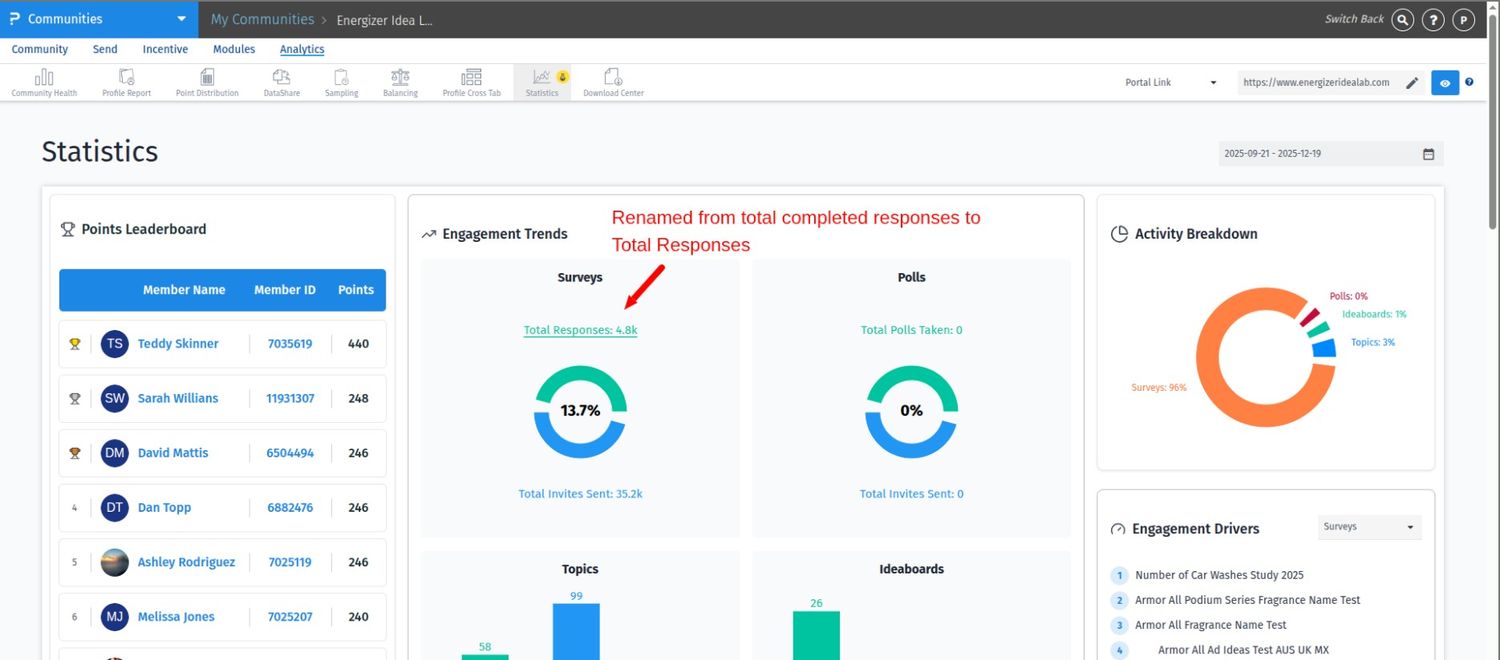
- Surveys: The Surveys card displays the engagement ratio by comparing the total number of responses collected with the total number of invitations sent. For example, if 100 invitations are sent and 25 responses are received, the survey engagement rate will be shown as 25%.
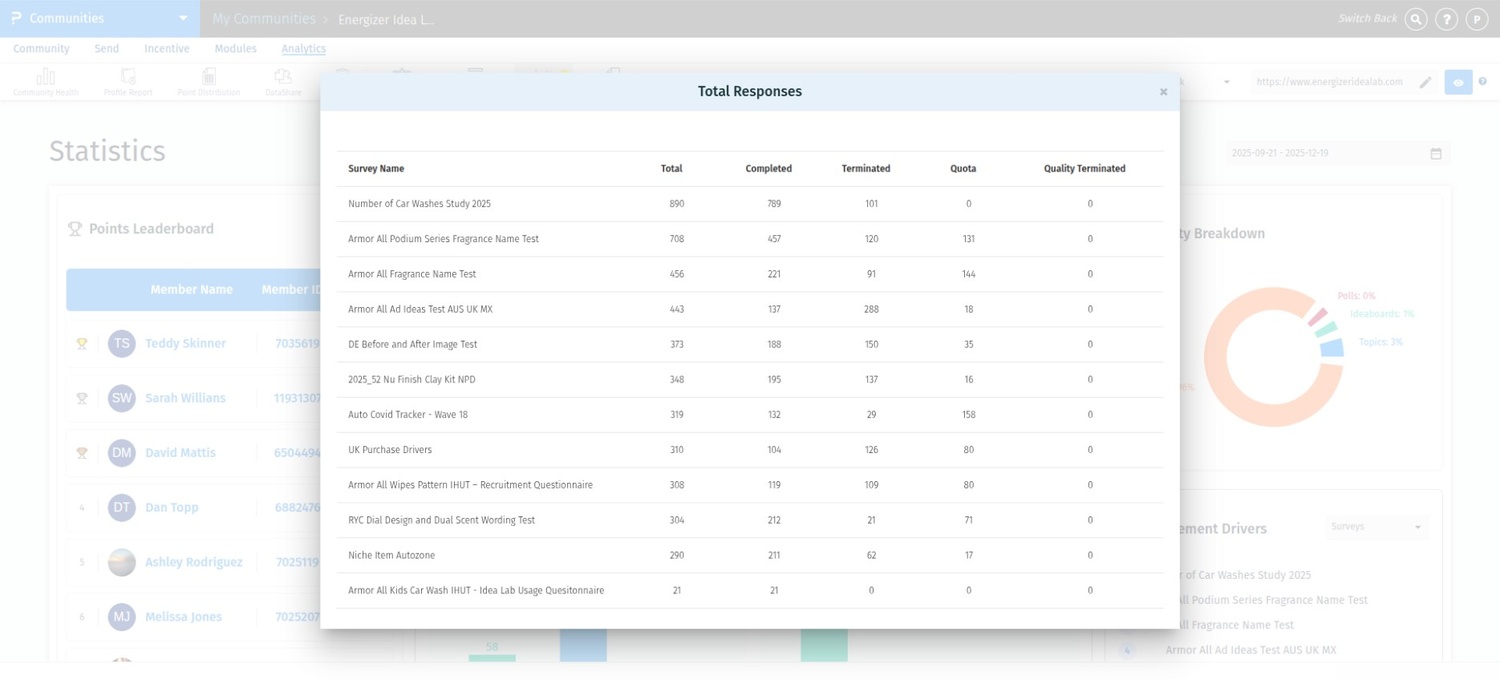
- Total Responses: metric shows the total number of survey responses recorded within the selected date range. This metric was previously labeled has been updated to include all response outcomes, providing a more accurate view of overall survey participation. Clicking on Total Responses: opens a modal with a survey-level breakdown of response activity. For each survey, the table displays the total number of responses along with counts for completed responses, terminated responses, quota-terminated responses, and quality-terminated responses. All values are calculated based on the selected date range and support performance analysis, reporting, and audits.
- Polls: The Polls card displays the engagement ratio by comparing the total number of responses collected with the total number of invitations sent. For example, if 100 invitations are sent and 25 responses are received, the survey engagement rate will be shown as 25%.
- Topics: The Topics card shows the total number of comments, likes, and dislikes received across all discussion topics within the selected timeframe. This provides a clear measure of overall interaction and sentiment within your community discussions.
- Ideaboards: The Ideaboards card shows the total number of comments, likes, and dislikes received across all ideaboards within the selected timeframe. This provides a clear measure of overall interaction and sentiment within your community discussions.
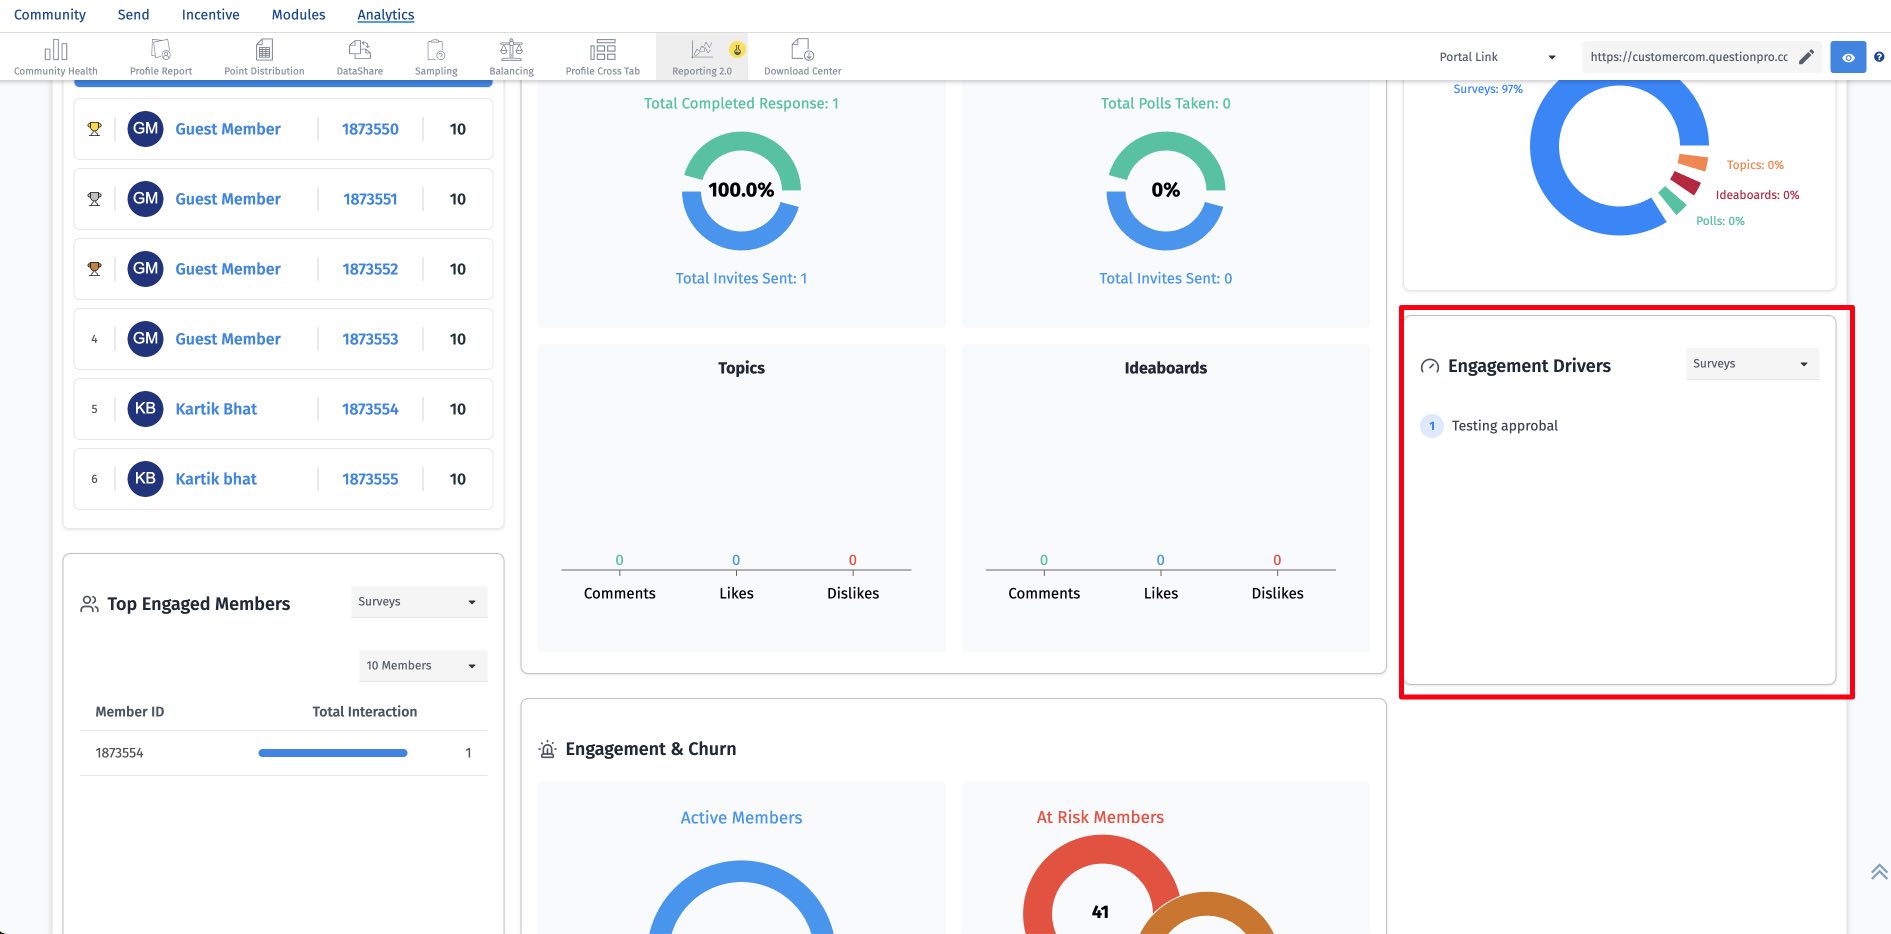
This view displays the top five items contributing to engagement within the selected activity. To explore the engagement drivers, choose an activity from the dropdown menu. The following are the activities you can select from the dropdown -
- Surveys: Will show the top 5 surveys driving engagement.
- Topics: Will show the top 5 topics driving engagement.
- Ideaboards: Will show the top 5 campaigns driving engagement.
- Polls: Will show the top 5 polls driving engagement.
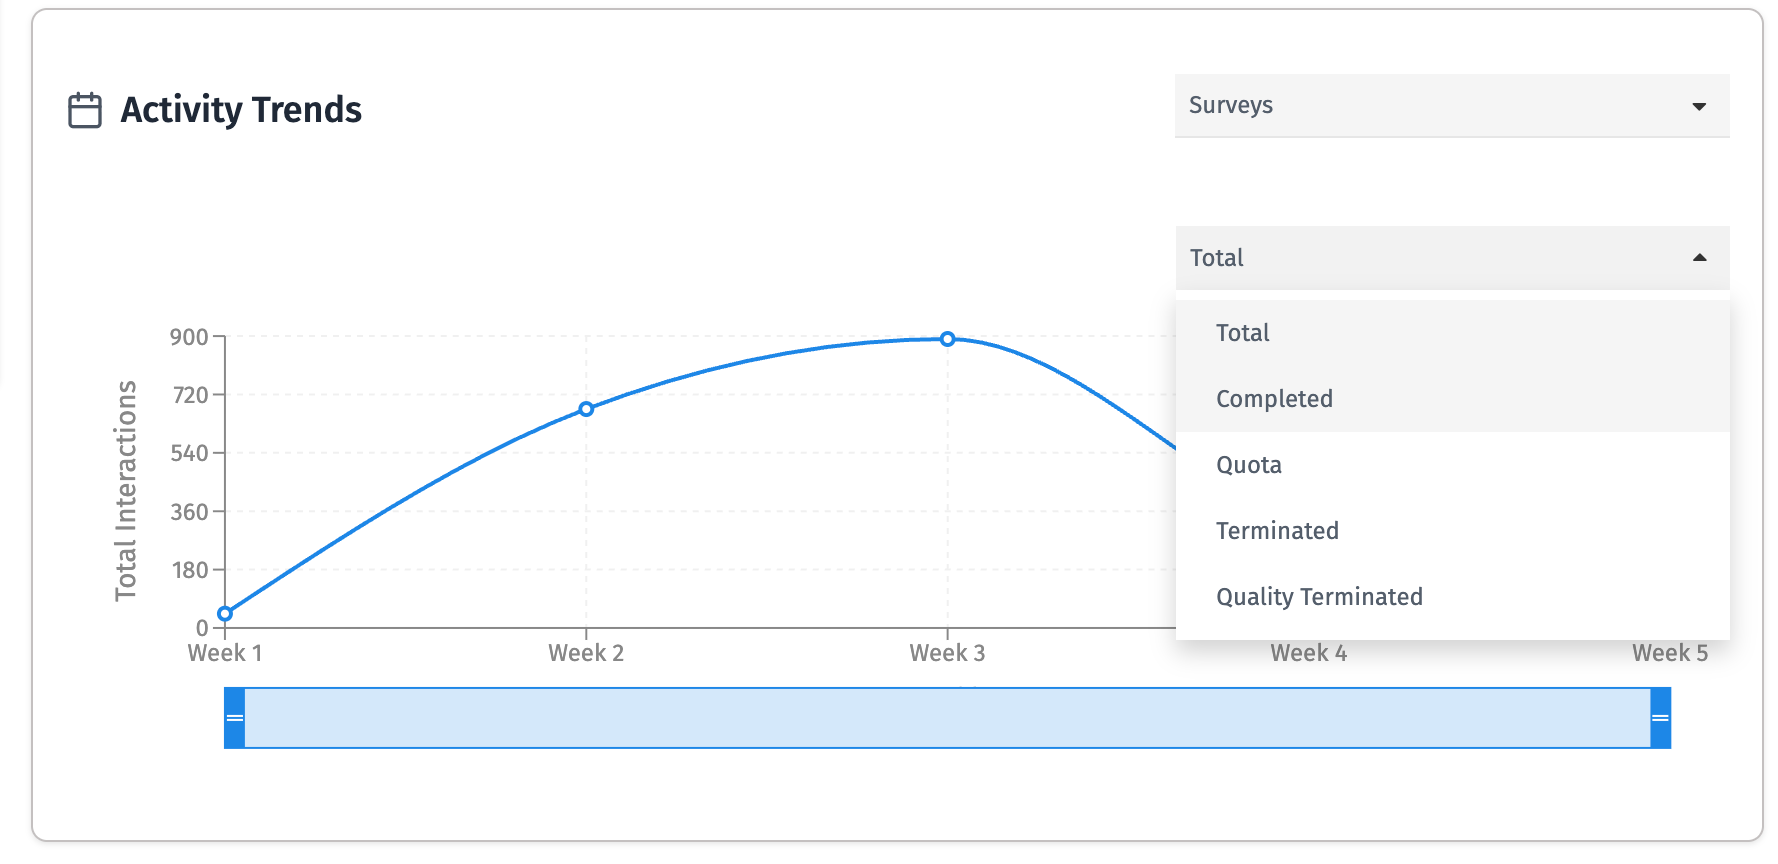
The Activity trend card shows the overall trend of members performing activities such as logging in, answering surveys, posting comments, and more over time.
If you select survey as an activity, you will get another dropdown for survey status. When Surveys is selected, an additional Survey Status filter is available to view trends by completion or termination status.
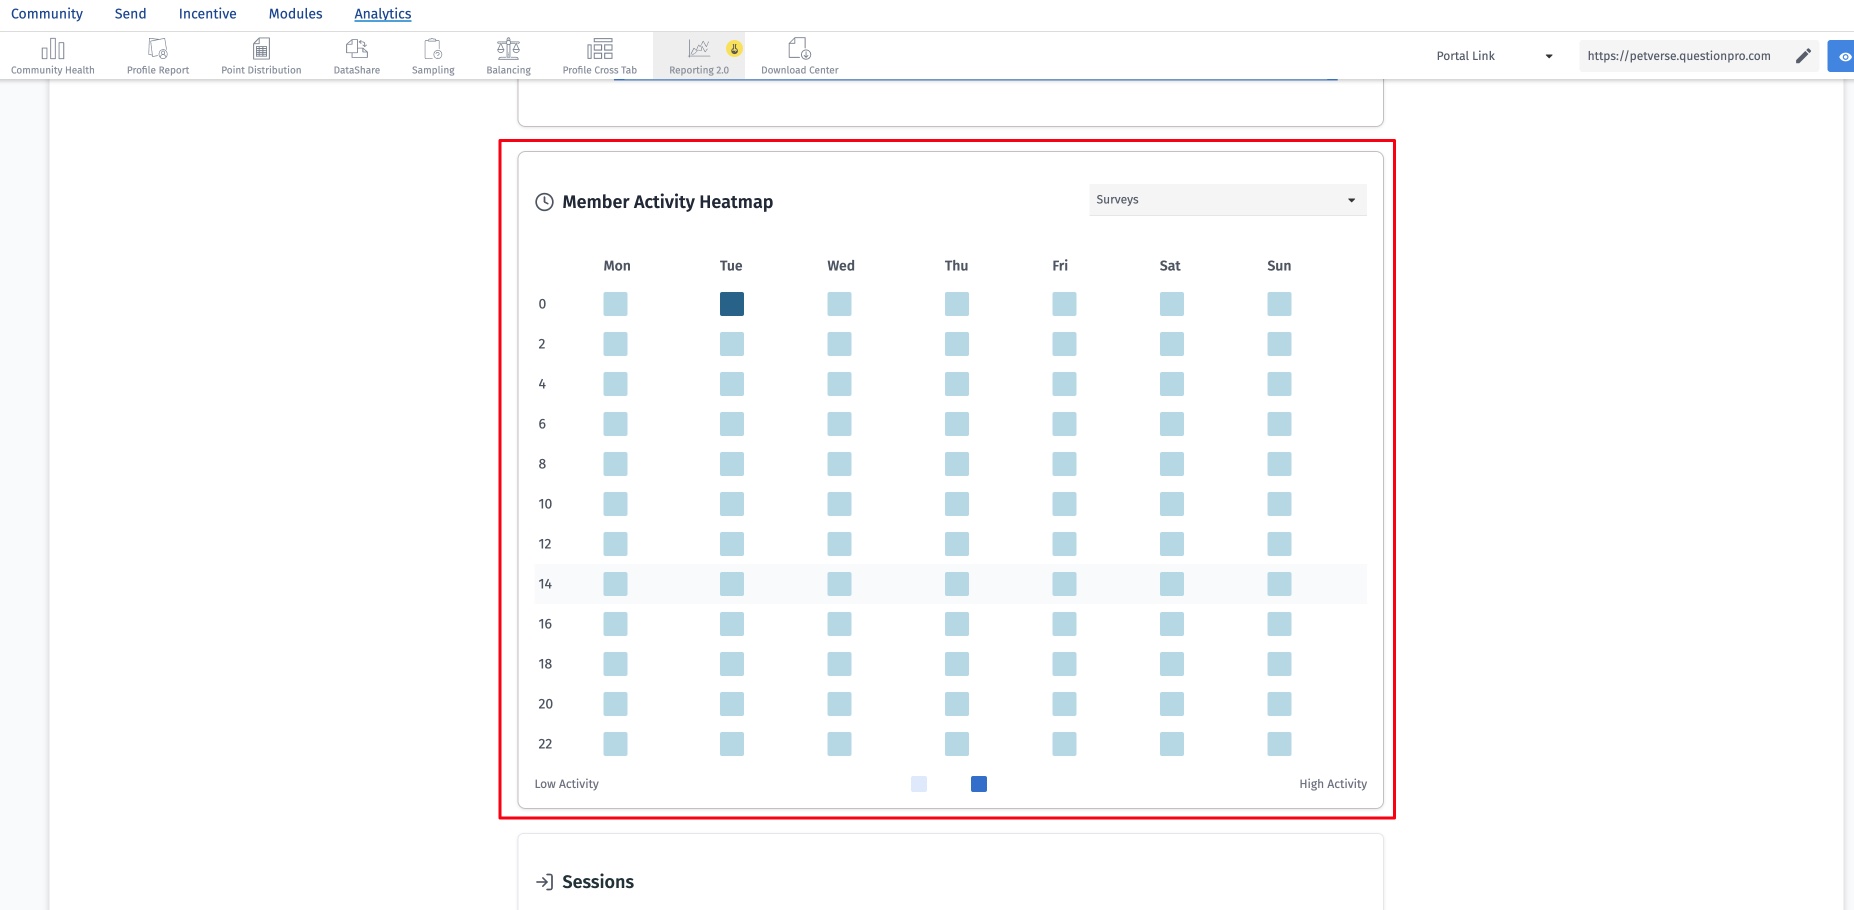
This visualization shows the days and times when members are most active, helping you determine the optimal time to send invitations for activities such as surveys, polls, and discussions.
This view displays the distribution of community engagement across different activities, such as surveys, polls, topics, and idea boards. It helps you understand which activities are driving the most participation within your community.
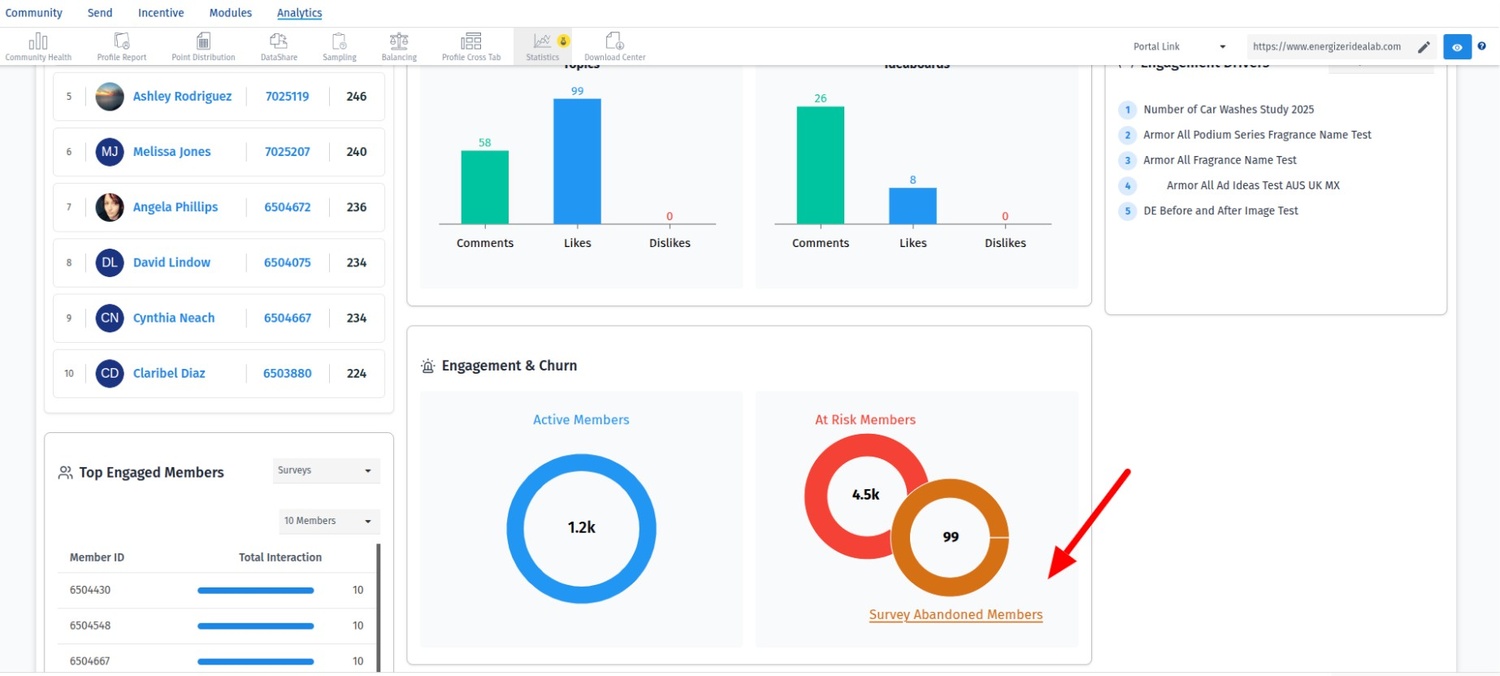
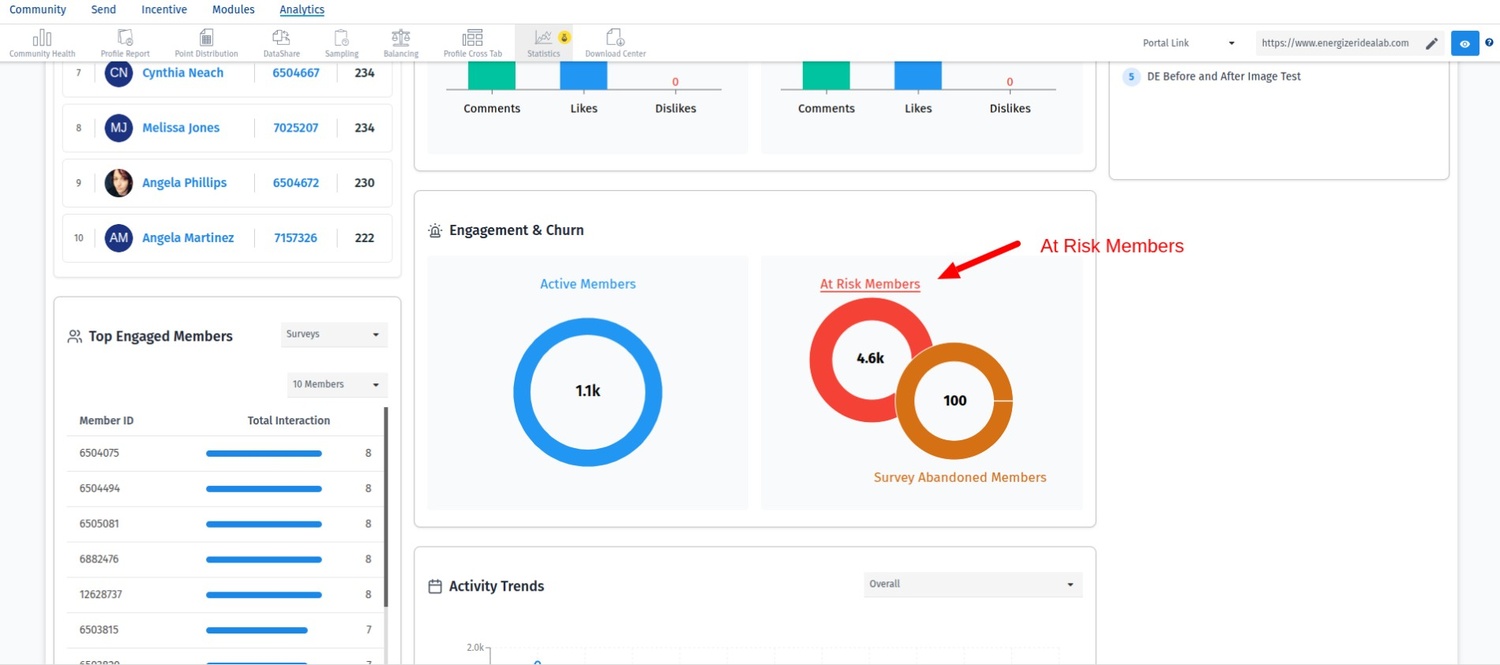
This view shows the distribution of members across three categories:
- Active members: Members participating in any community activity in the given timeframe.
- Survey Abandoned: metric displays the number of members who have not participated in any surveys because they were not invited to any survey during the selected date range. On Clicking a detailed list of members who were not included in any survey invitations. Since these members did not receive survey invites, they did not participate in any survey activities.
- At-risk members:The At-Risk Members metric represents members who were invited to one or more activities during the selected date range but did not participate in any of them. These members received invitations; however, no response or activity was recorded. Clicking At-Risk Members opens a detailed list of members who were invited but did not engage with the activities. This view helps administrators identify disengaged members, assess invitation effectiveness, and take targeted actions to improve participation and retention.
For performance reasons, the time filter is currently limited to 90 days. This limit will be increased to 12 months in Phase 2.
No, the data cannot be exported at this time. This feature is planned for a future update.
Phase 2 is scheduled for release in Q1 2026.