
- Add widgets
- Survey Comparison
- Heatmap
- Anonymity Settings
- eNPS in Workforce Analytics Portal
- QxBot Assist in Workforce
- Notes Widget
- Text Analysis Widget
- Response rate
- Text Report
- Trend analysis widget
- Show/hide Markers and Building blocks
- Question Filter
- Single Question Widget
- Heatmap default
- Sentiment analysis
- Scorecard
- Driver analysis
- Scorecard: All options view
- Heatmap Custom Columns
- 360 feedback introductory text
- 360 feedback display configurations
- 360 feedback display labels
- Multi Level Priority Logic
- 360 Surveys- Priority Model
- 360 feedback - skip logic
- 360 feedback - show hide question logic
- 360 Survey Settings
- 360 feedback configuration
- Customize the validation text
- 360 Survey design
- 360-Reorder section
- 360 Section Type - Single Select Section
- 360 Delete Sections
- 360 Add Sections
- 360 section type - Free responses text section
- 360 Section Type - Presentations text section
- 360 Section-Edit Configurations
- 360 Survey- Languages
- Matrix section
Spider chart
Spider chart is a quick visual summary of the scores leader receives on the competencies from their 360 degree feedback. Competencies with higher ratings will have higher spikes, and competencies with lower ratings show dips. This is an effective and efficient way for a leader, or 360 degree feedback subject, to see their strengths and opportunities to improve.
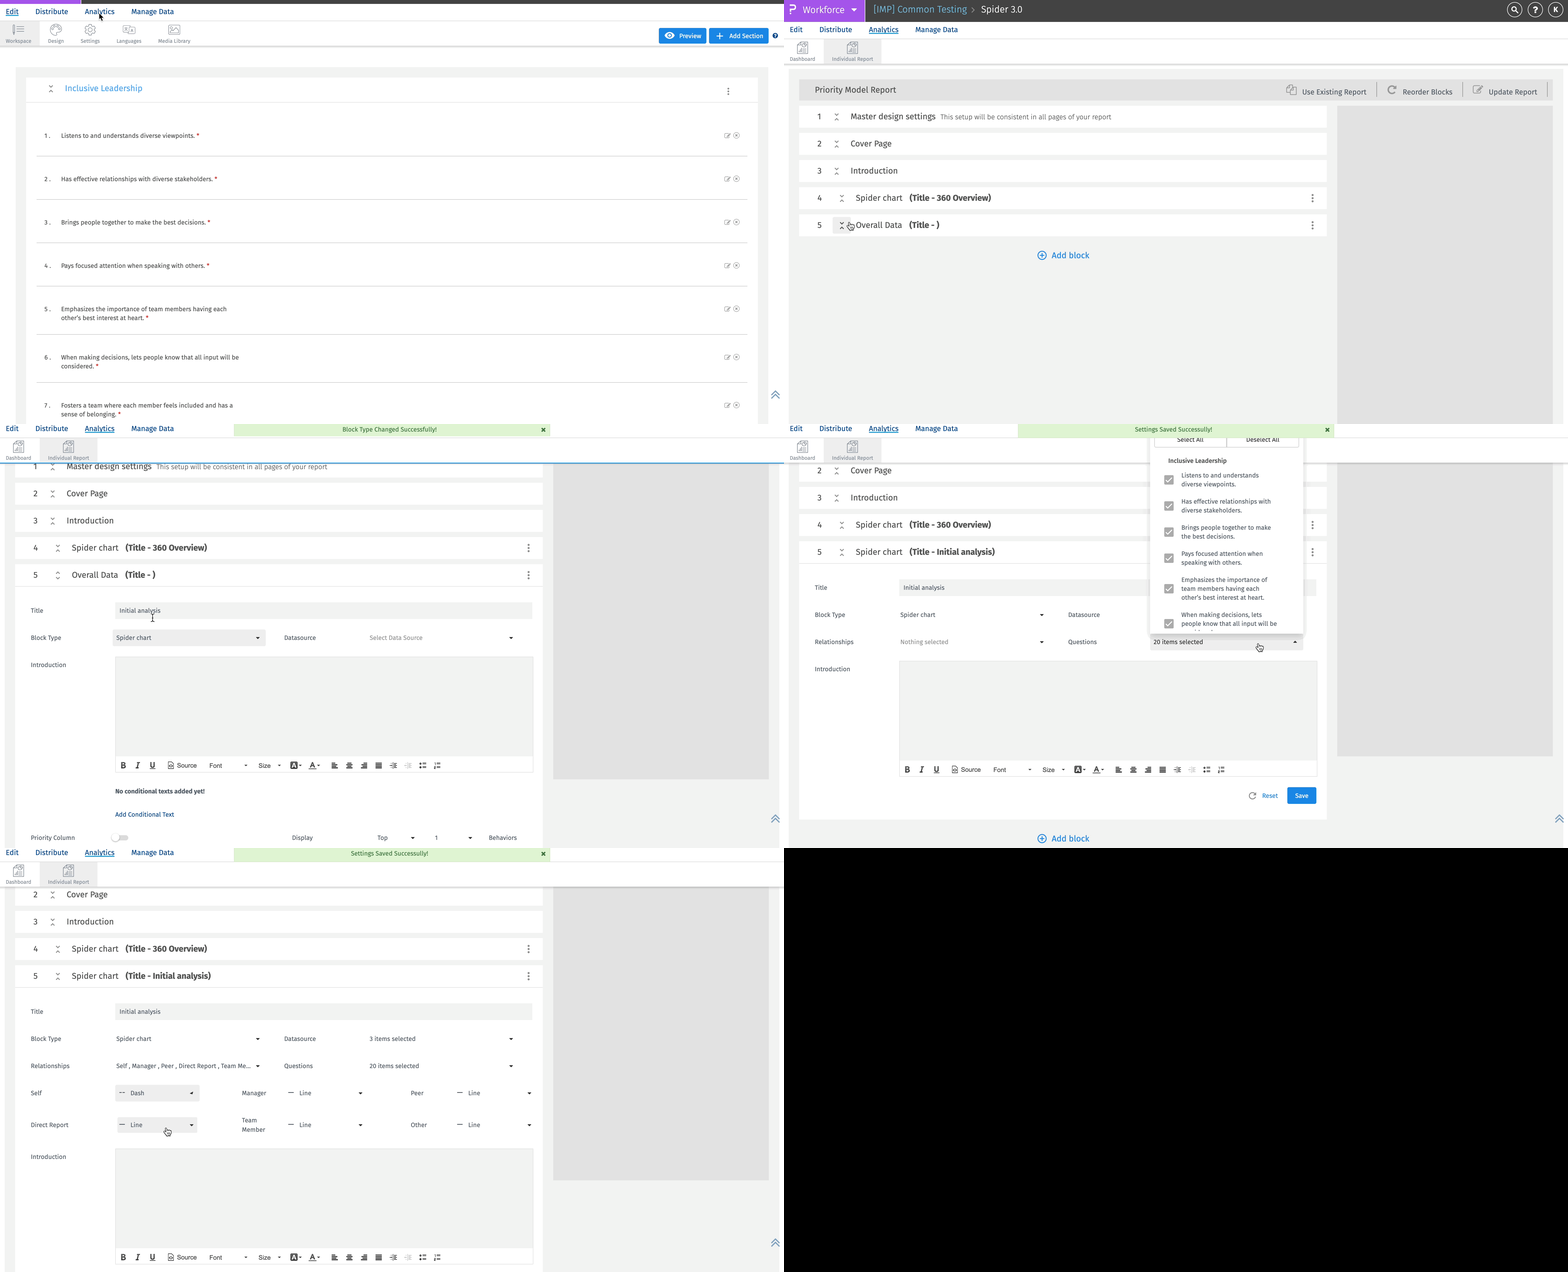 Click to download video
How do I utilize Spider chart capabilities?
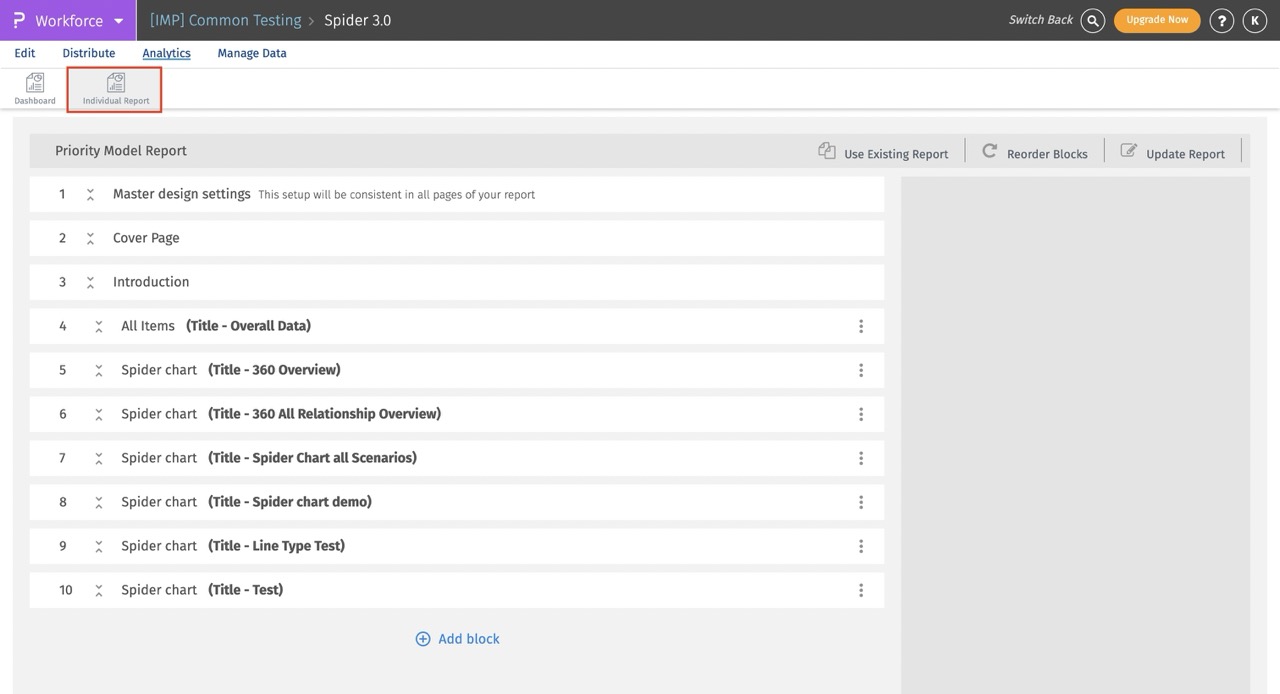
- Click on “Analytics“
- Click on the individual report tab
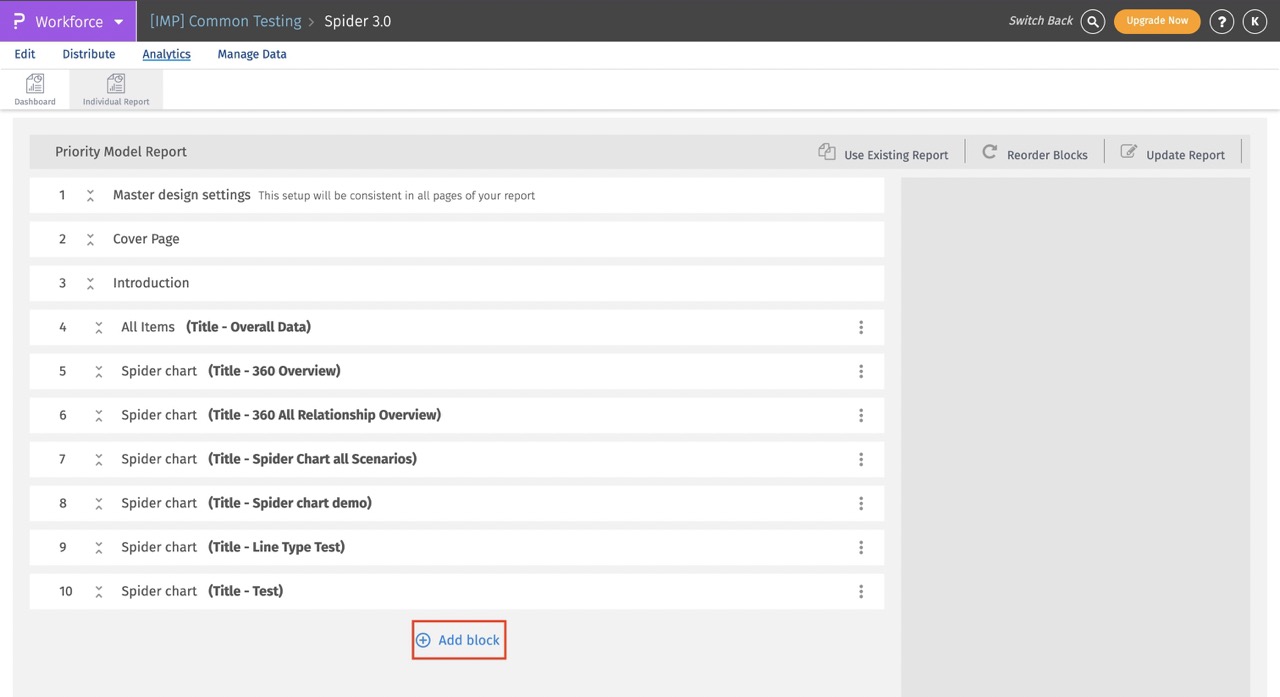
- Click on “Add new block”
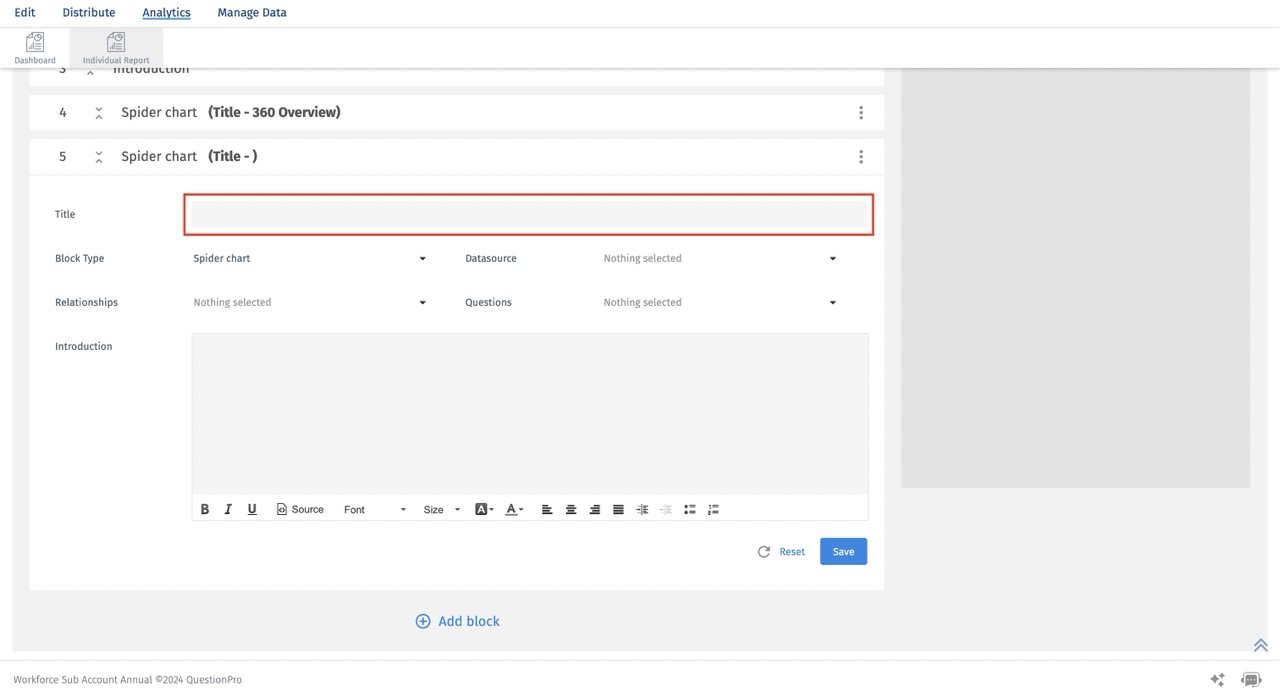
- Expand the created block by clicking on the block and enter the title of the block
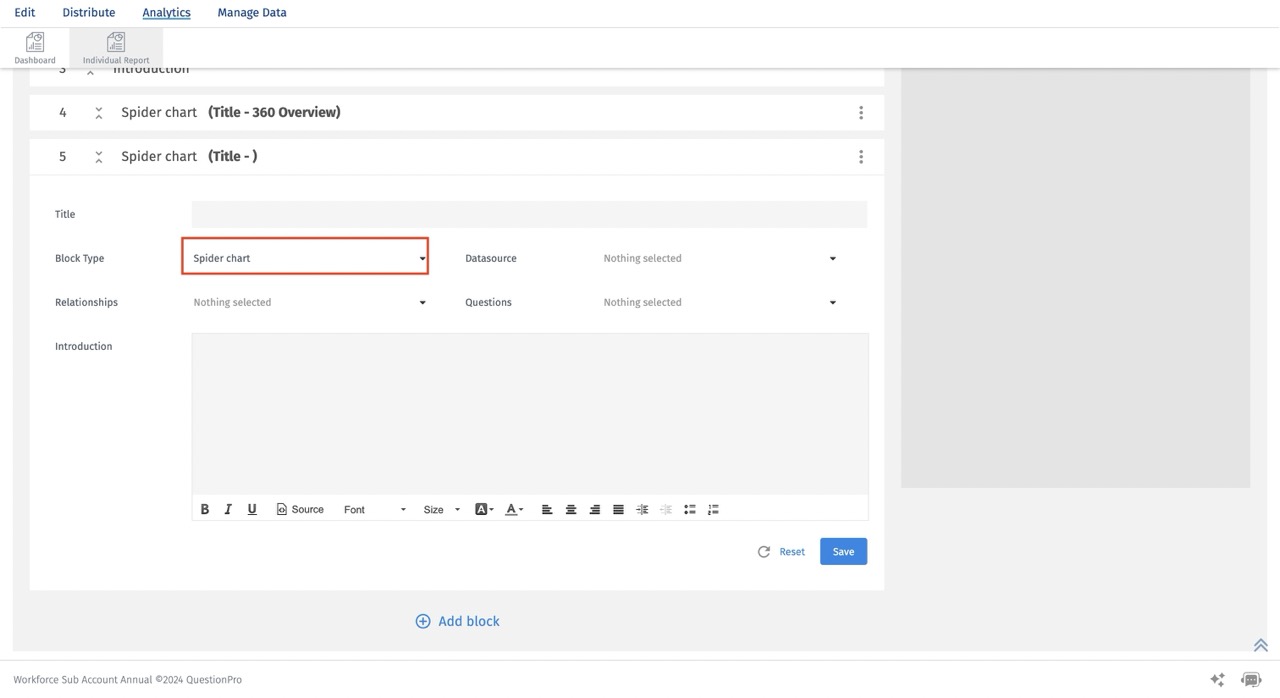
- Select block type as "Spider chart" from the drop-down
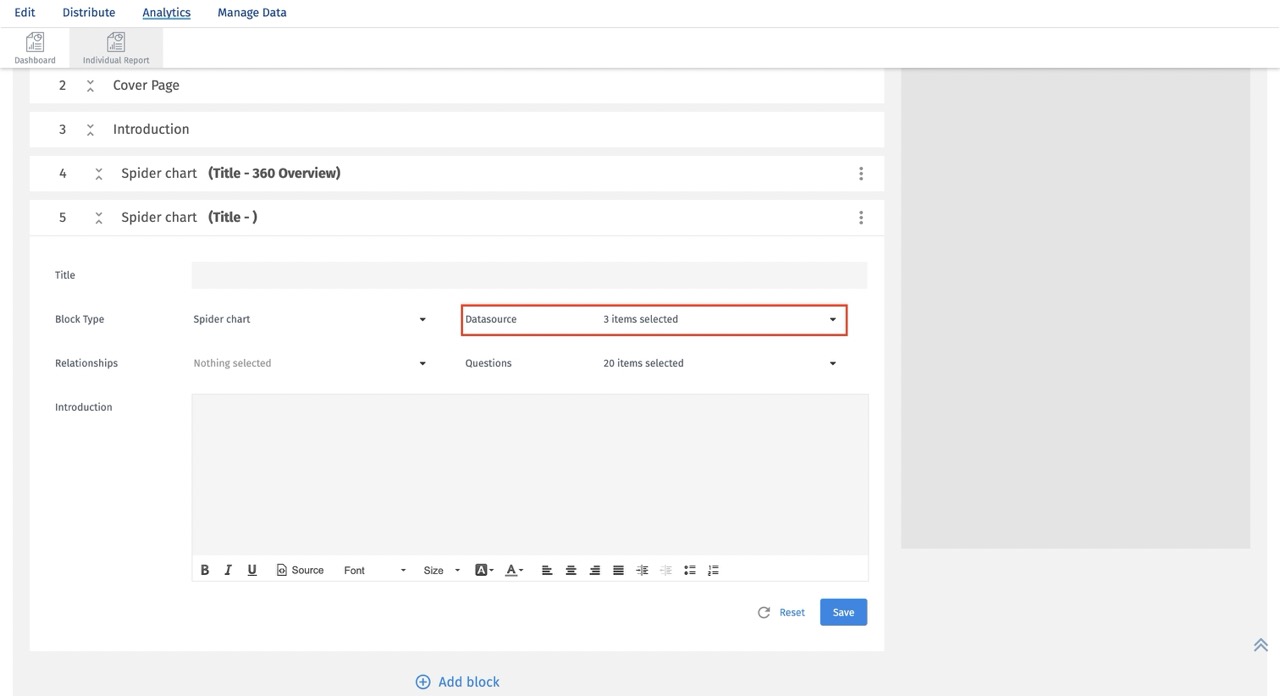
- Select at least 3 competencies from the data source
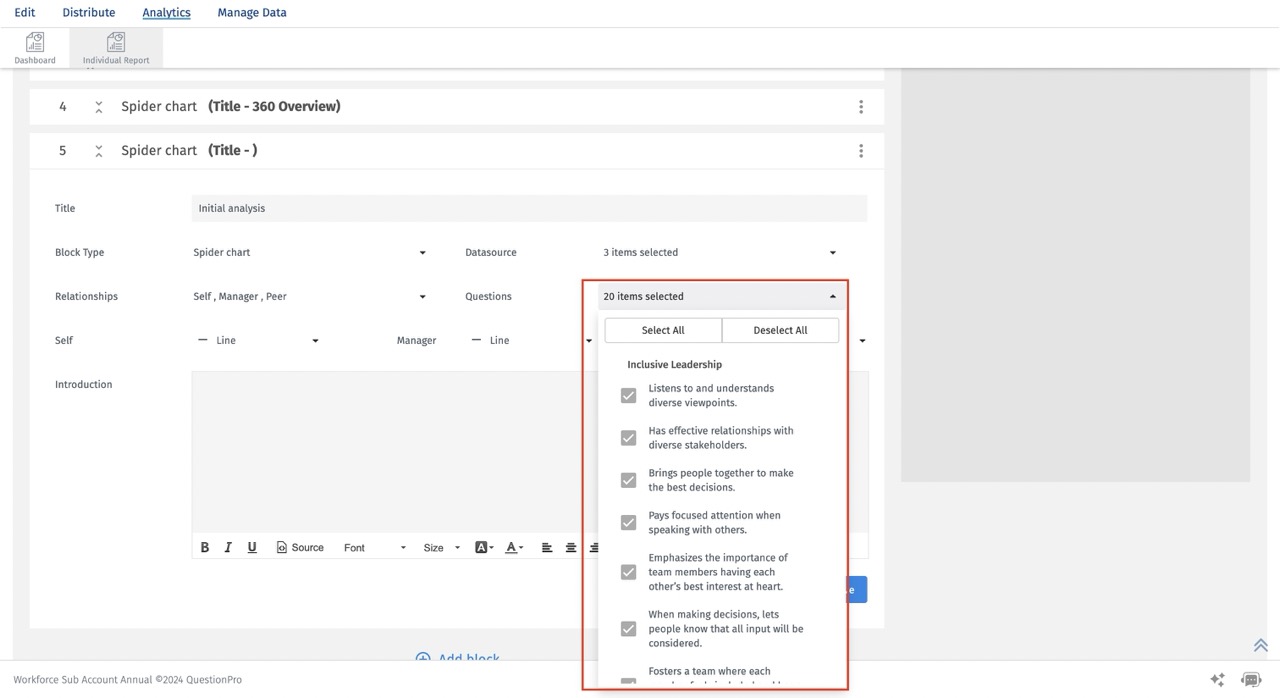
- All the questions are preselected from the selected competencies in the data source.You can choose choose unselect questions based on the requirment
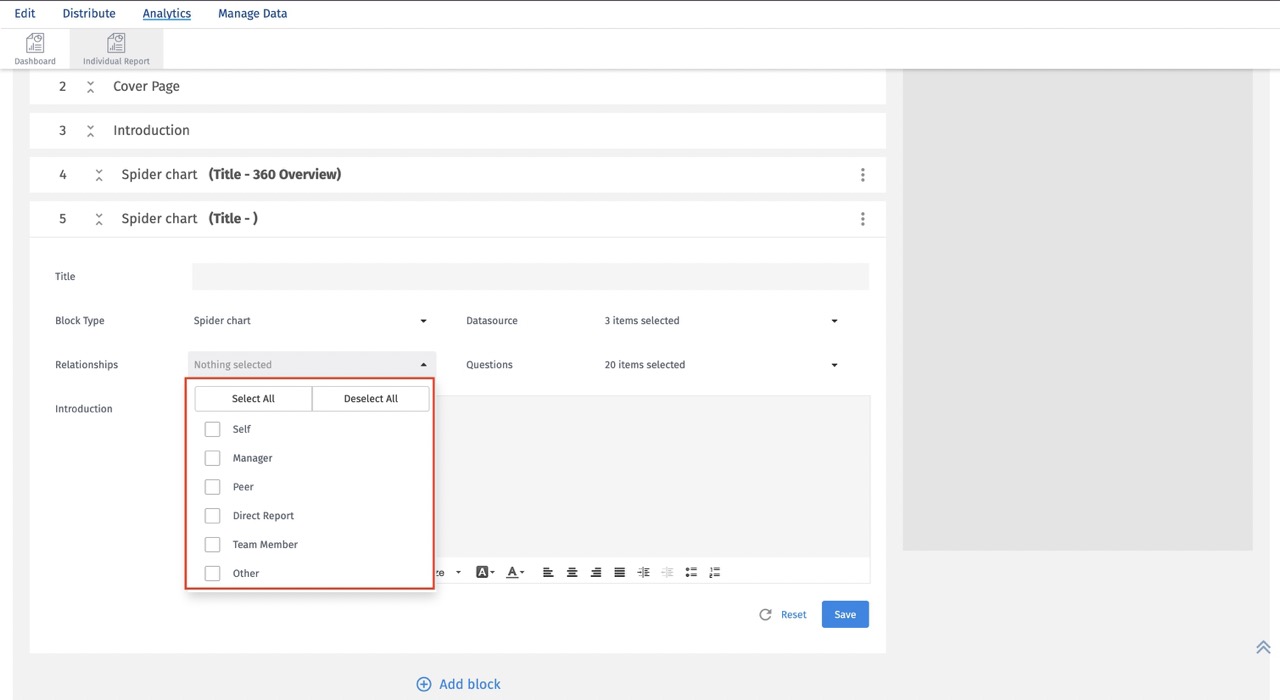
- Select the relationships required for comparison
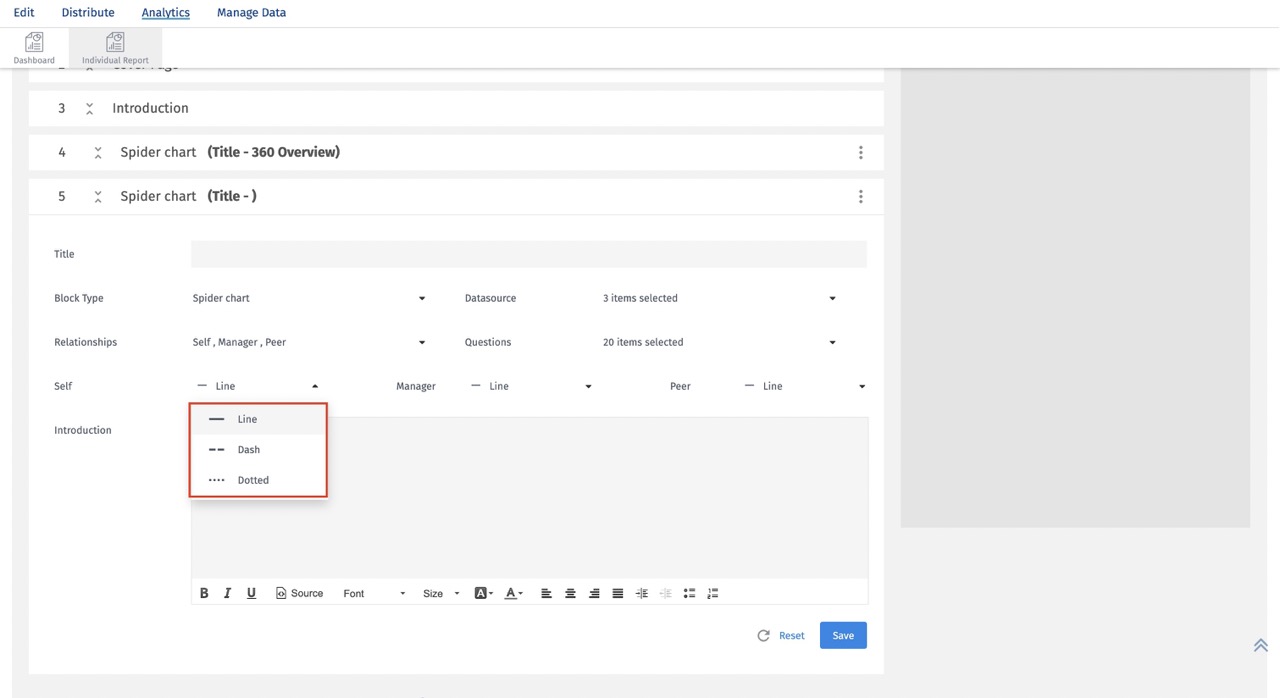
- Select the line style for every relationship you selected
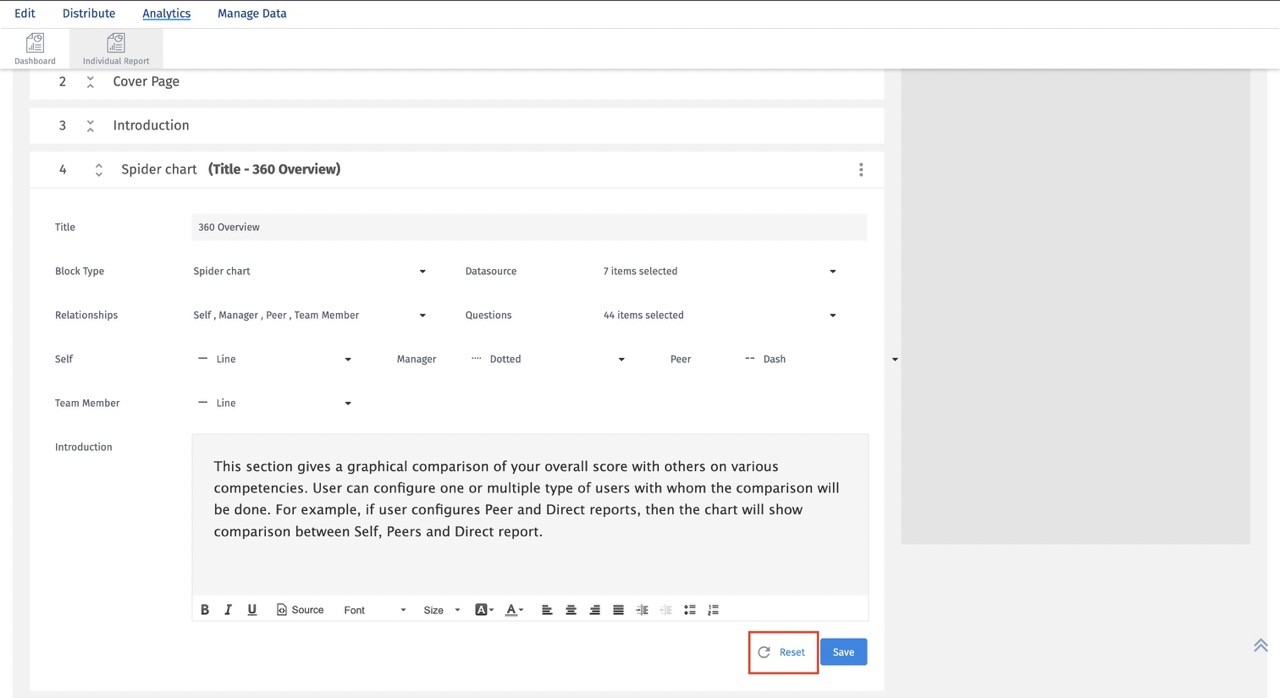
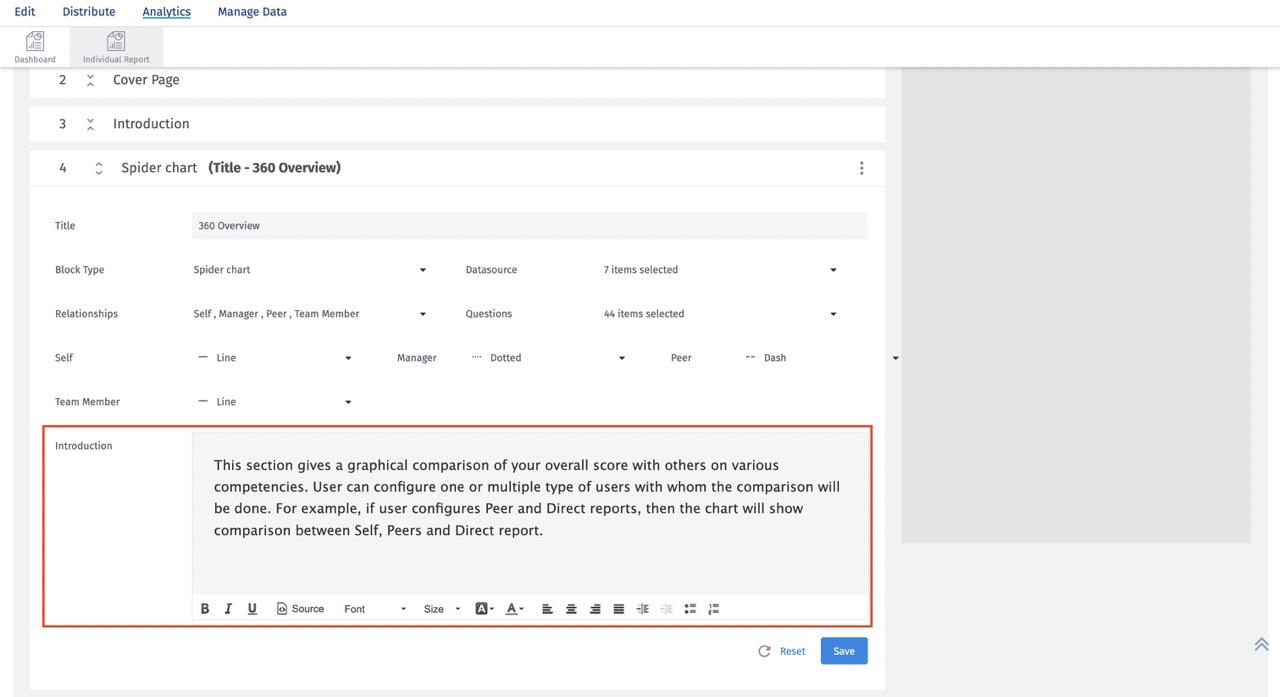
- Add an optional introduction about the chart
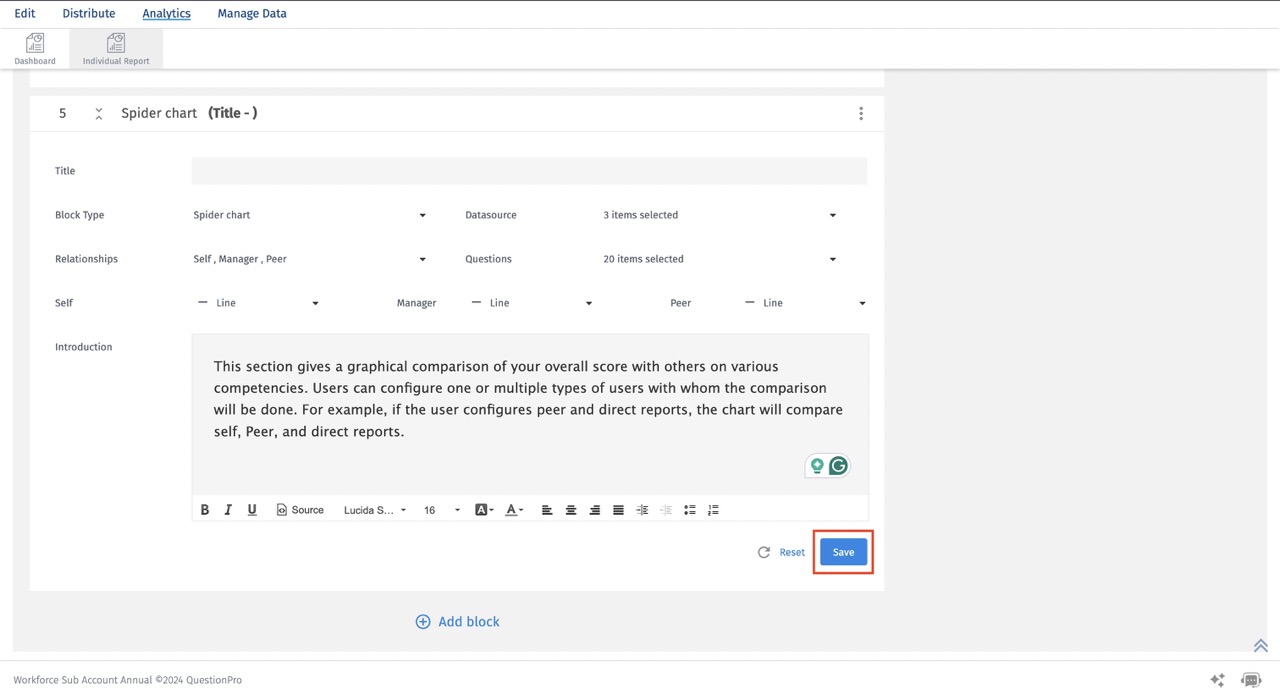
- Click on “save” to save the block settings
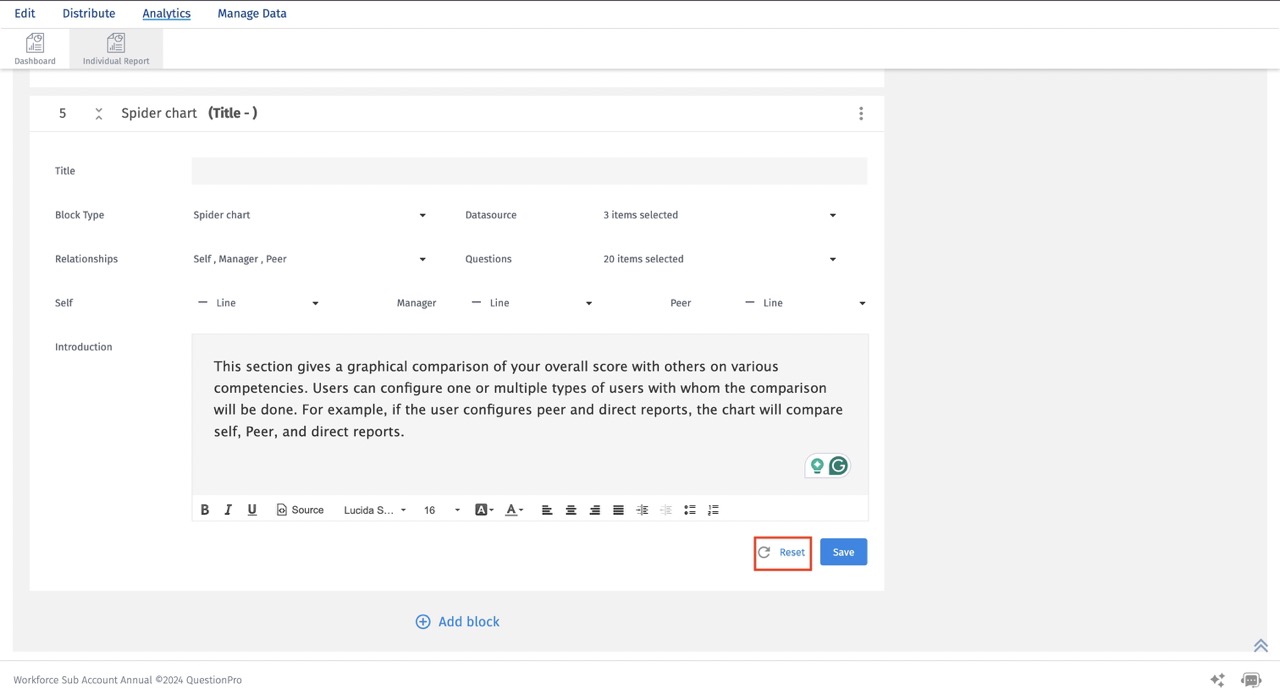
- If you need to reset all the settings then click on “reset” button
You may also be interested in...

