
- Add widgets
- Survey Comparison
- Heatmap
- Anonymity Settings
- eNPS in Workforce Analytics Portal
- QxBot Assist in Workforce
- Notes Widget
- Text Analysis Widget
- Response rate
- Text Report
- Trend analysis widget
- Show/hide Markers and Building blocks
- Question Filter
- Single Question Widget
- Heatmap default
- Sentiment analysis
- Scorecard
- Driver analysis
- Scorecard: All options view
- Heatmap Custom Columns
- 360 feedback introductory text
- 360 feedback display configurations
- 360 feedback display labels
- Multi Level Priority Logic
- 360 Surveys- Priority Model
- 360 feedback - skip logic
- 360 feedback - show hide question logic
- 360 Survey Settings
- 360 feedback configuration
- Customize the validation text
- 360 Survey design
- 360-Reorder section
- 360 Section Type - Single Select Section
- 360 Delete Sections
- 360 Add Sections
- 360 section type - Free responses text section
- 360 Section Type - Presentations text section
- 360 Section-Edit Configurations
- 360 Survey- Languages
- Matrix section
360 report - Block types
You can create the Report using the default given section or create a custom one by adding a new block. Click on add new block and select the type of the block from the dropdown list
-
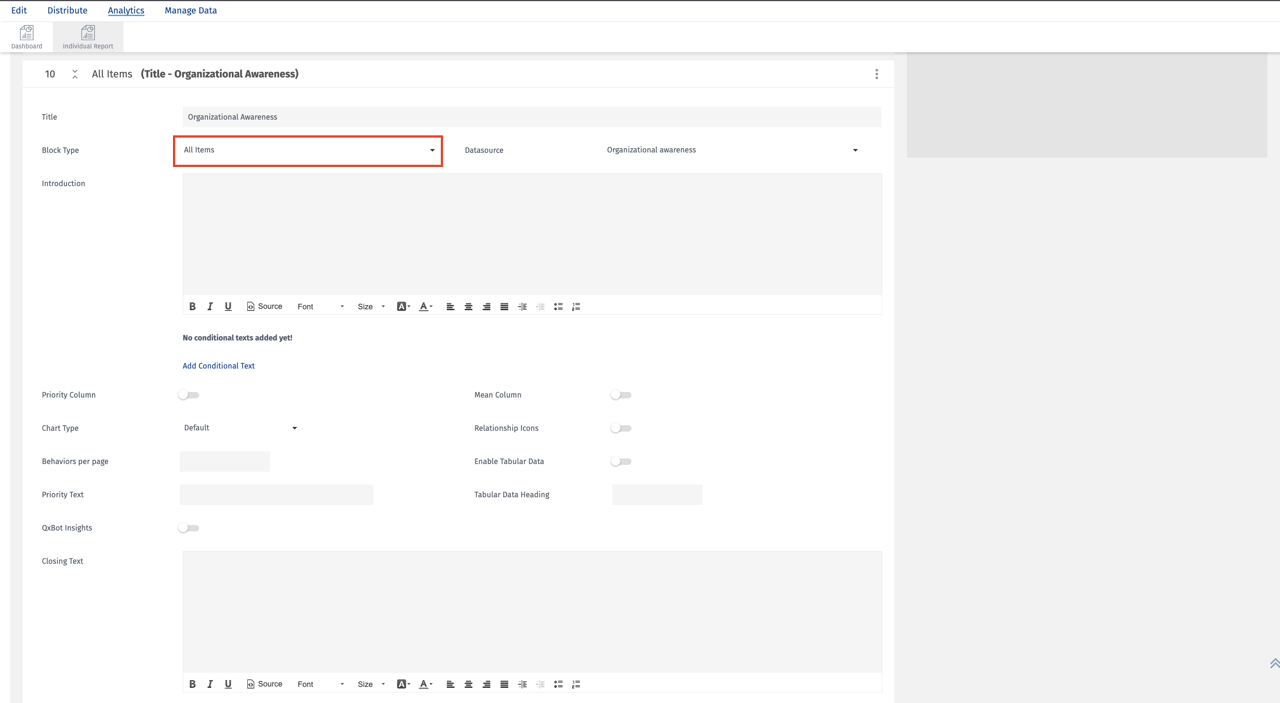
All Items Block
- Title: Add Title here for the Block, It will appear in the 360 report.
- Block Type: Select the required block type from the list of blocks available.
- Data Source: Select a data source to fetch data for the selected block. ( Sections that are created)
- Introduction: Add Introduction text or image to display at the start of the block page.
- Add Conditional Text: Use the conditional text option to add conditional text based on the average score of the selected block source.
- Relationship Icons: Add color to each relationship to show them in different colors i.e Self, Manager, Direct Report etc.
- Priority Column: Enable the toggle to display priority votes in the table. Applicable only If you are using priority logic in the matrix question.
- Behaviours per page: Enter the number of behaviours to display a specific number of behaviours per page in the report.
- Priority Text: Add text here to add column header text for behaviour column. Closing Text: Add Introduction text or image to display at the start of the block page.
- Mean Column: Enable or disable to show and hide the mean column
- Relationship Icon: Enable or disable to show and hide the Relationship Icons
- Enable Tabular Data: Enable showing the table data which displays scores by relationship (self, manager, others, overall) and High vs Low range
- Tabular Data Heading: If Tabular Data is enabled add the title for the tabular data.
-
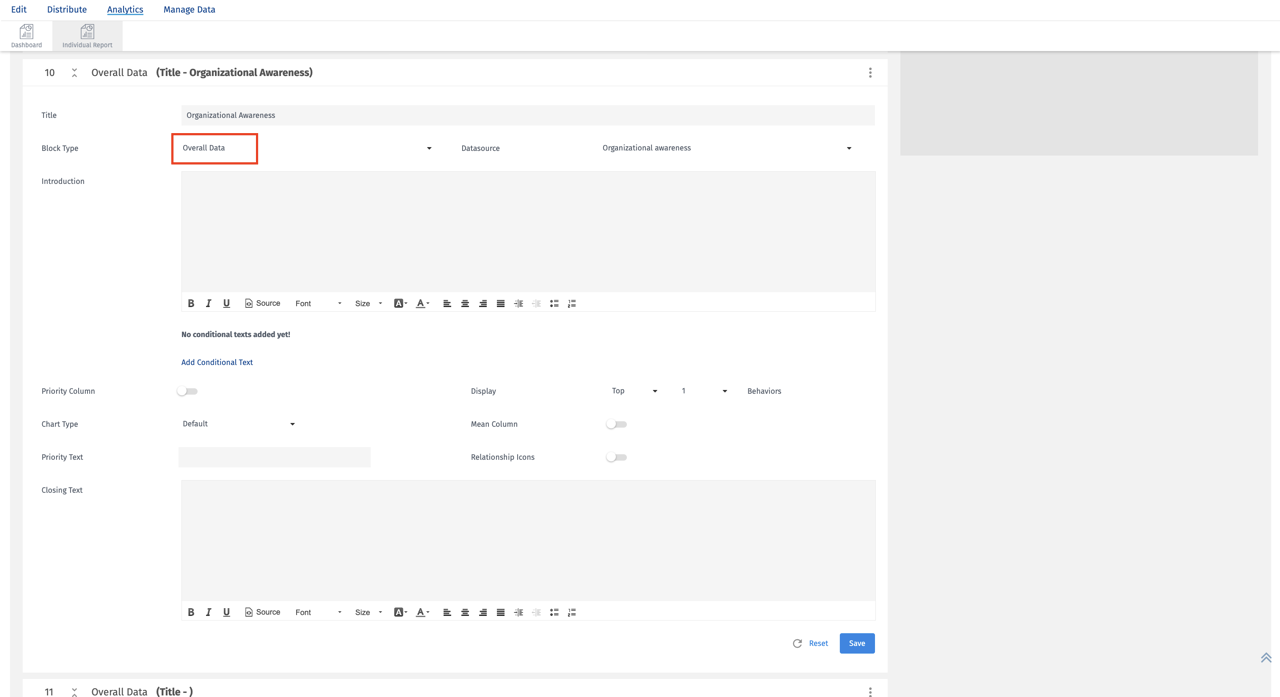
Overall data
- Overall Data block is similar to the All Items block. In addition to the options available under all items block, we have an ability to highlight the highly rated behaviours when using Priority Logic on Matrix Question in the Survey.
- Display: You can display a maximum of the top 5 priority behaviours from the Matrix Question type.
- The title, Introduction and Closing Text can be modified in the block. Relationship Icons can be disabled on the block level if required.
- The rest of the block functions are similar to those of the All Items block.
-
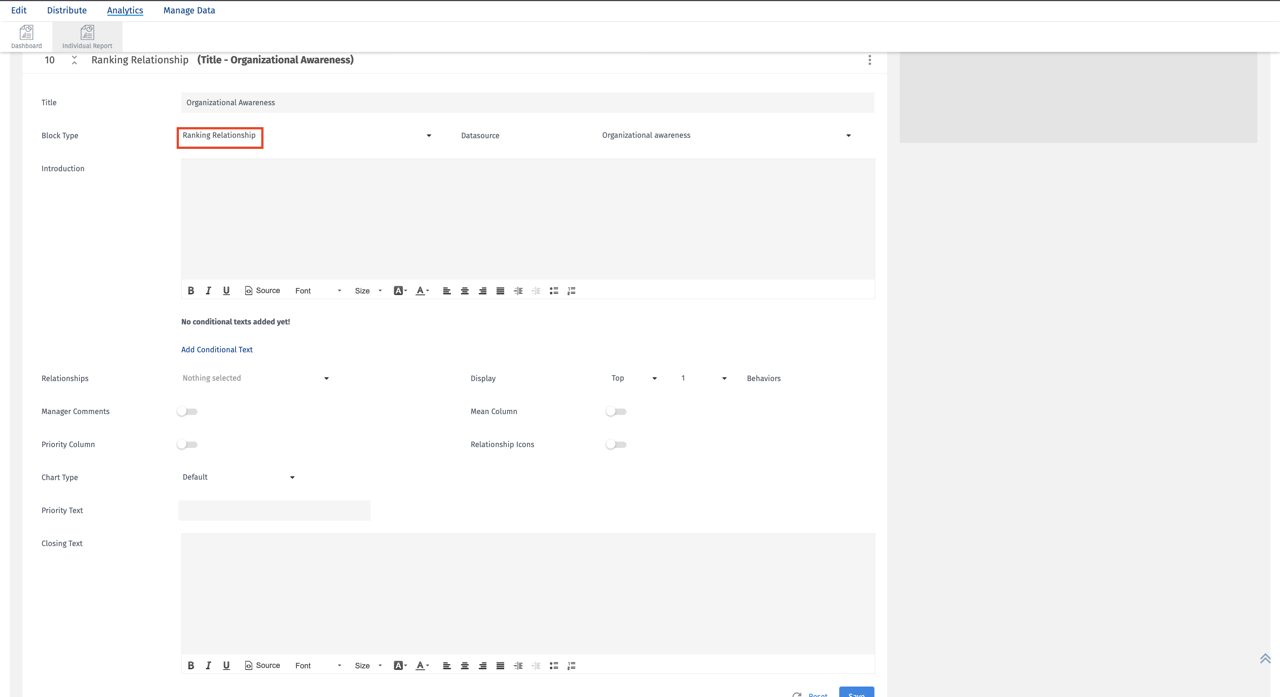
Ranking Relationship Block
- Ranking by Relationship Block will allow administrators to display priorities by each selectrelationship. This block is similar to the overall data block but in addition to selecting the top priority up to 5 here administrators can display the priority by each relationship.
- Manager comments can be enabled to display comments along with the top priorities.
- Administrators can display a maximum of 5 priorities for each relationship selected.
- All other functions of this block are similar to the All Items block.
-
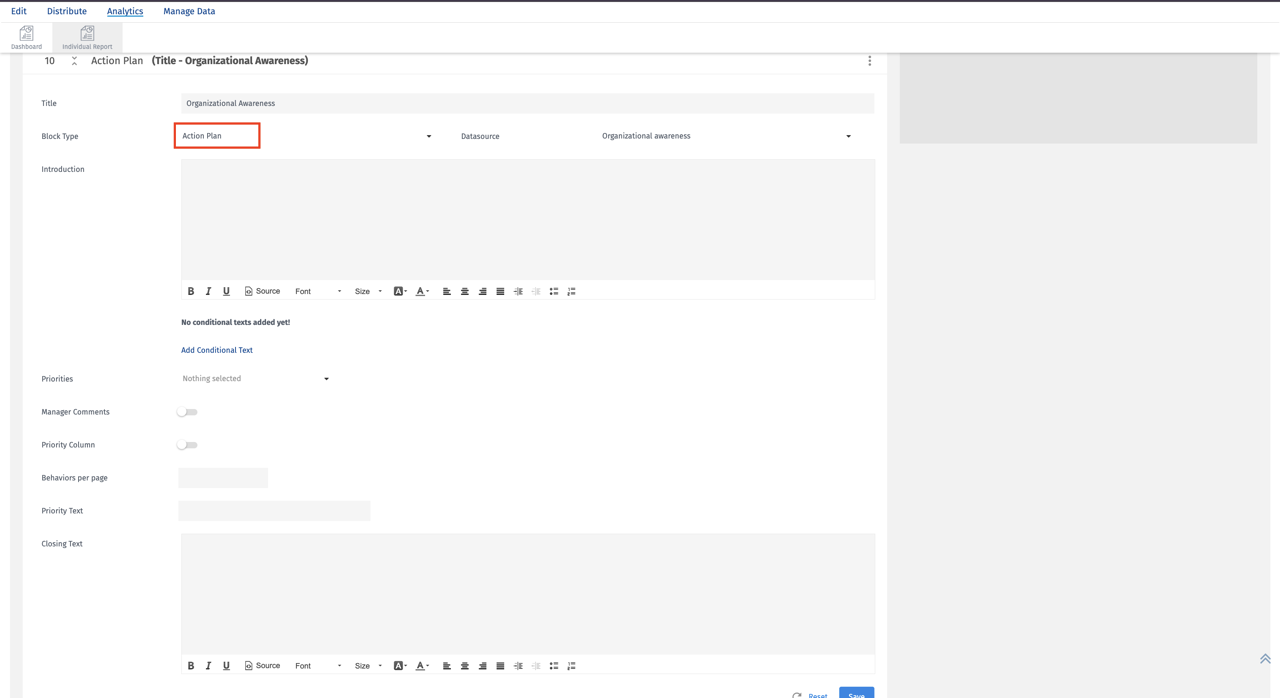
Action Plan Block
- Action plans can be tagged to the priorities in the report. You can add an action-planning pages to the report by selecting Individual priorities i.e #1, #2, #3 or a group of top priorities #1 to #3.
- Select priorities to be displayed in the Action Plan Block.
-
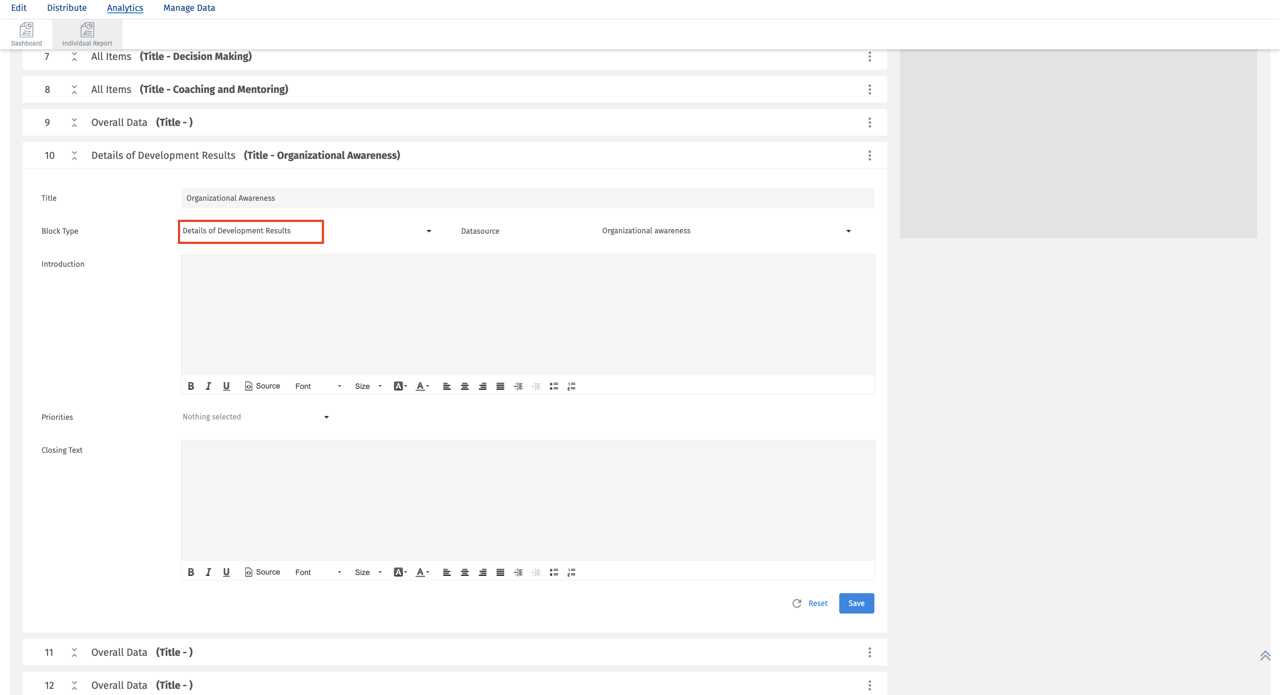
Details of Development Results
- Details of the Development Results Block allow administrators to display selected priority comments in the report.
- You can select Individual priorities i.e. #1, #2, #3 or all priorities #1 to #N.to display comments tagged to each priority in the order of highest to lowest.
- Selected priority comments will be listed in order of priority #1, #2, #3 etc..
-
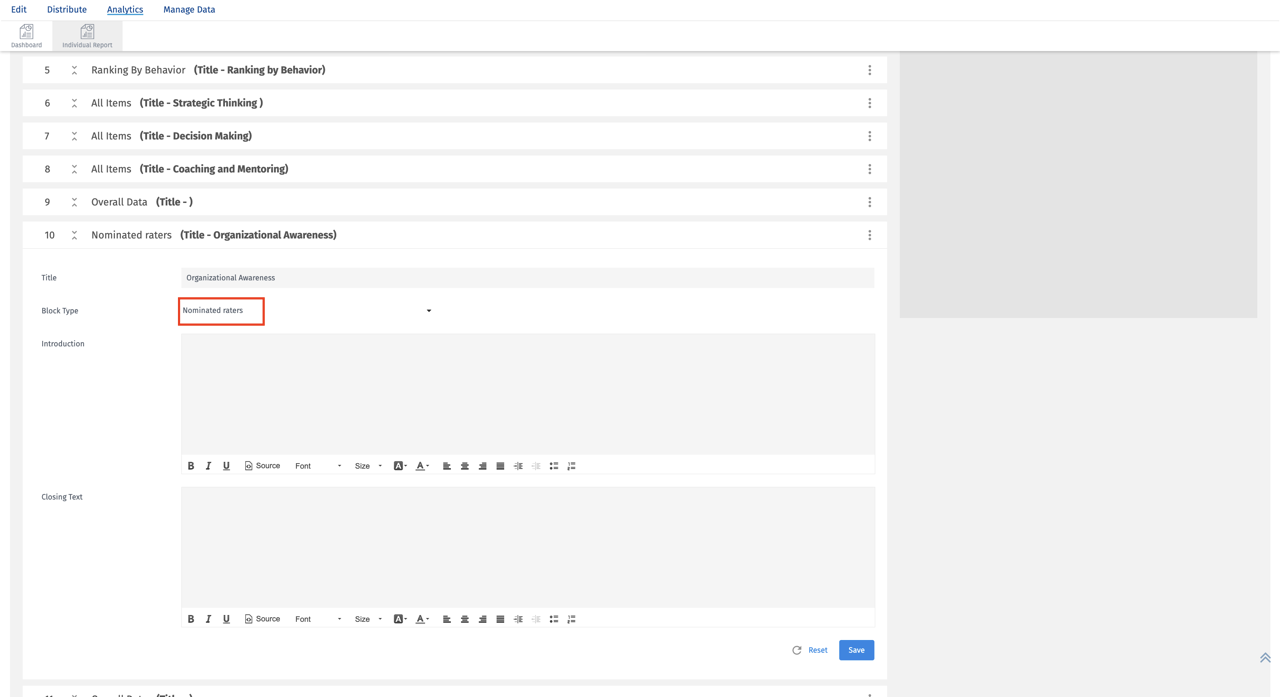
Nominated Raters Block
- Add this block to display nominated raters as a separate page in the report. If you want to display this information outside the cover page.
- You can add Introduction and Closing Text if required to this block.
-
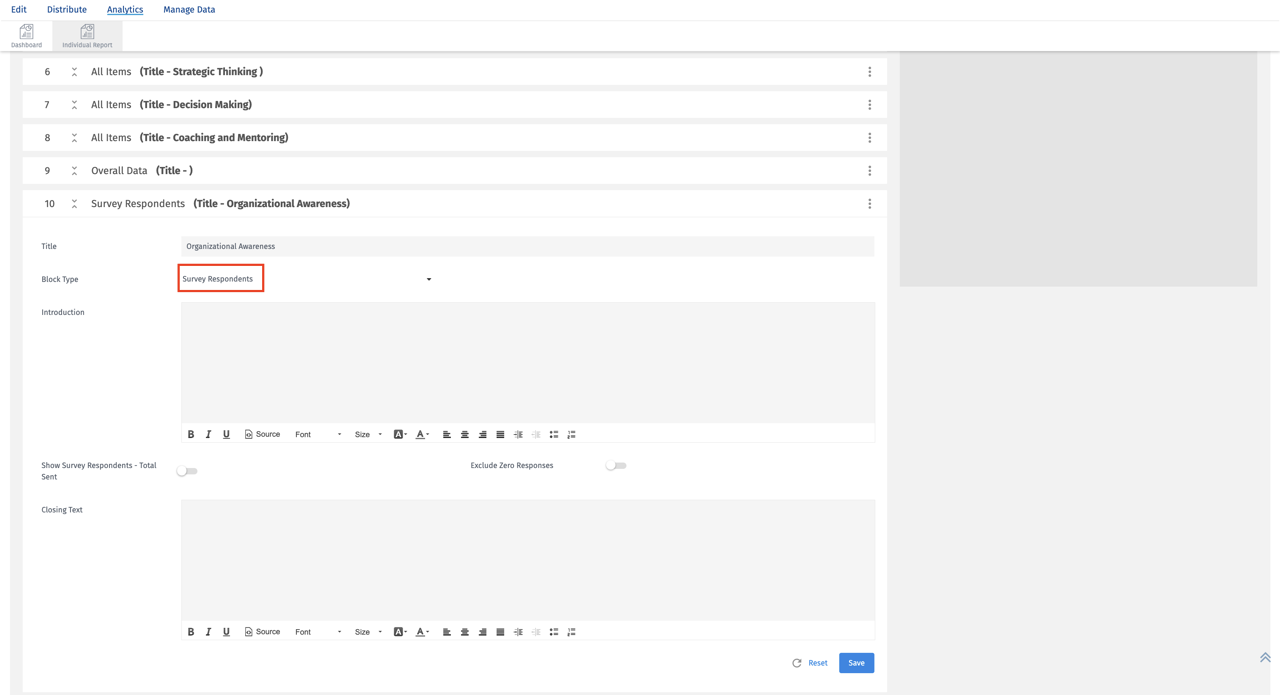
Survey Respondents Block
- Add this block to display survey respondents by each relationship as a separate page in the report. If you want to display this information outside the cover page.
- You can enable or disable the total evaluations count and also hide the relationship with 0 nominations.
-
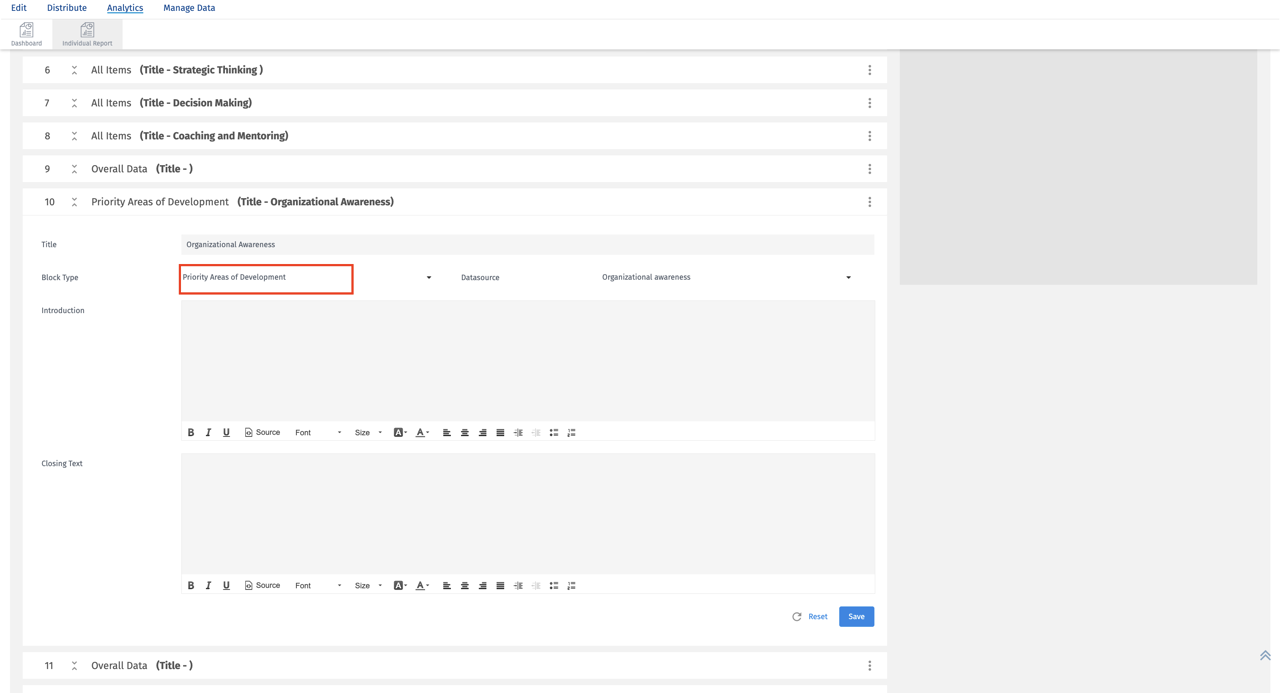
Priority Areas of Development Block
- Add this block to display behaviors in the order of priority votes from highest voted priority. Use this block when using Priority Logic.
-
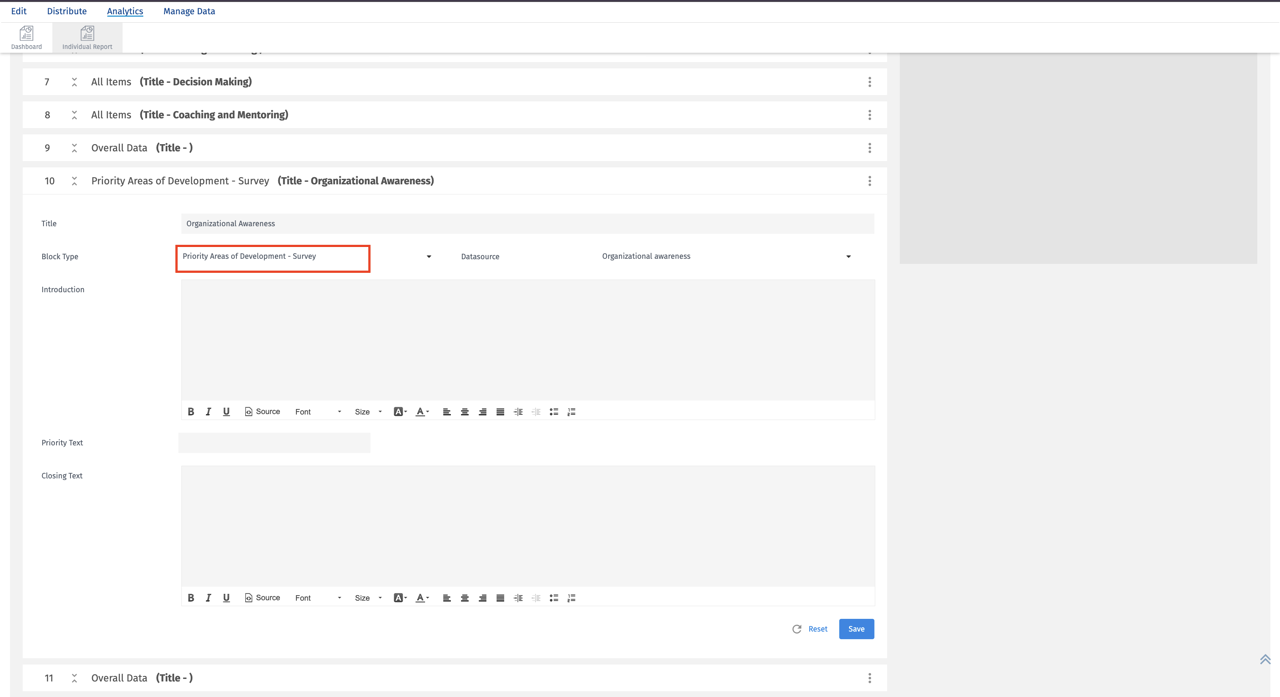
Priority Areas of Development - Survey Block
- If you have multiple matrix questions representing different competencies. Add this block to display competencies from highest to lowest. You can give custom header text to represent the column displaying competencies.
-
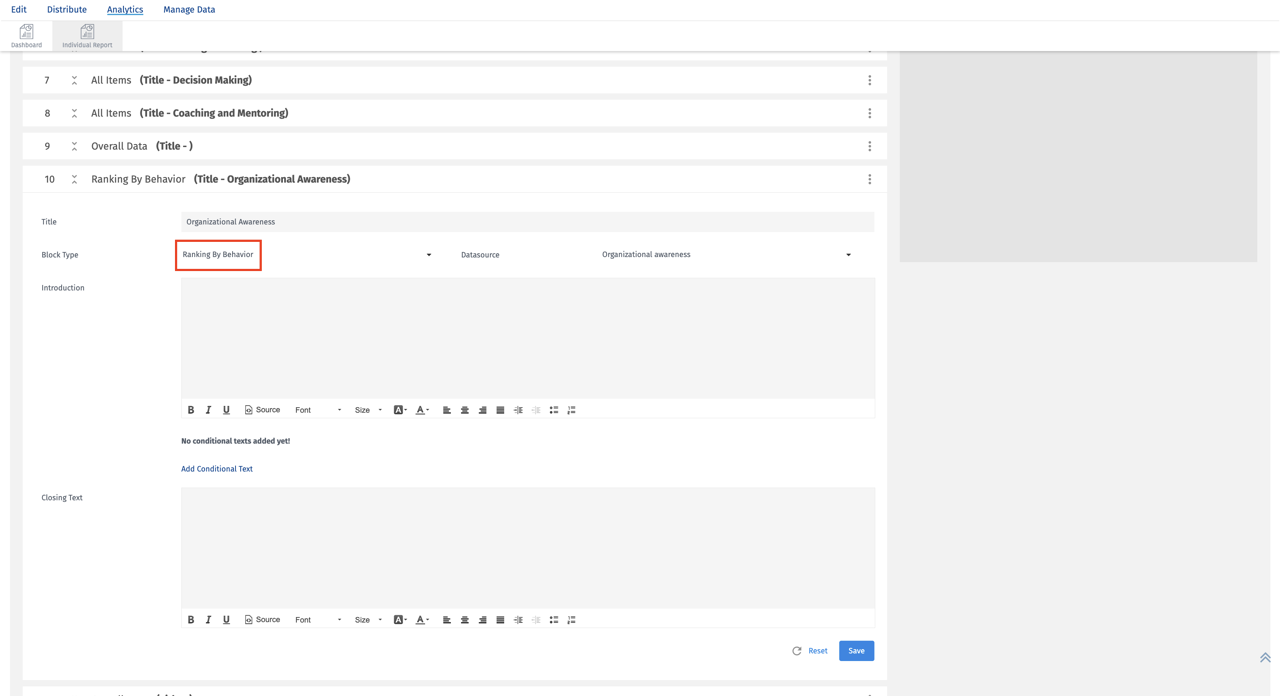
Ranking by Behavior Block
- Add this block to display top 5 and bottom 5 behaviors. Behaviors will be pulled from different matrix questions in the survey, if more than 1 matrix question is used.
-
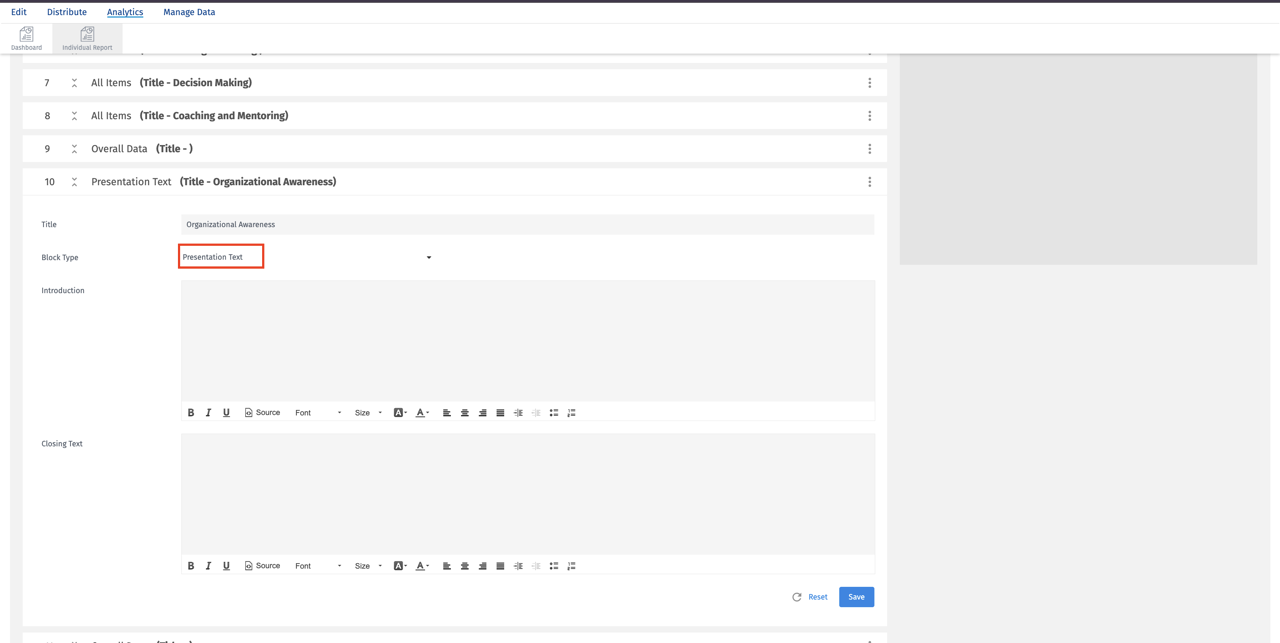
Presentation Text Block
- Add this block to add text or images anywhere in between the report. You can Introduction through Presentation Text or Description or closing notes using this Presentation Text Block.
- You can add images or text in the report through presentation text.
You may also be interested in...

