

- Add widgets
- Survey Comparison
- Heatmap
- Confidentiality Settings
- eNPS in Workforce Analytics Portal
- Notes Widget
- Text Analysis Widget
- Response rate
- Text Report
- Trend analysis widget
- Show/hide Markers and Building blocks
- Question Filter
- Single Question Widget
- Heatmap default
- Sentiment analysis
- Scorecard
- Driver analysis
- Scorecard: All options view
- Heatmap Column Types
- Multiple Tabs in a Dashboard
- 360 feedback introductory text
- 360 feedback display configurations
- 360 feedback display labels
- Multi Level Priority Logic
- 360 Surveys- Priority Model
- 360 feedback - skip logic
- 360 feedback - show hide question logic
- 360 Survey Settings
- 360 feedback configuration
- Customize the validation text
- 360 Survey design
- 360-Reorder section
- 360 Section Type - Single Select Section
- 360 Delete Sections
- 360 Add Sections
- 360 section type - Free responses text section
- 360 Section Type - Presentations text section
- 360 Section-Edit Configurations
- 360 Survey- Languages
- Matrix section

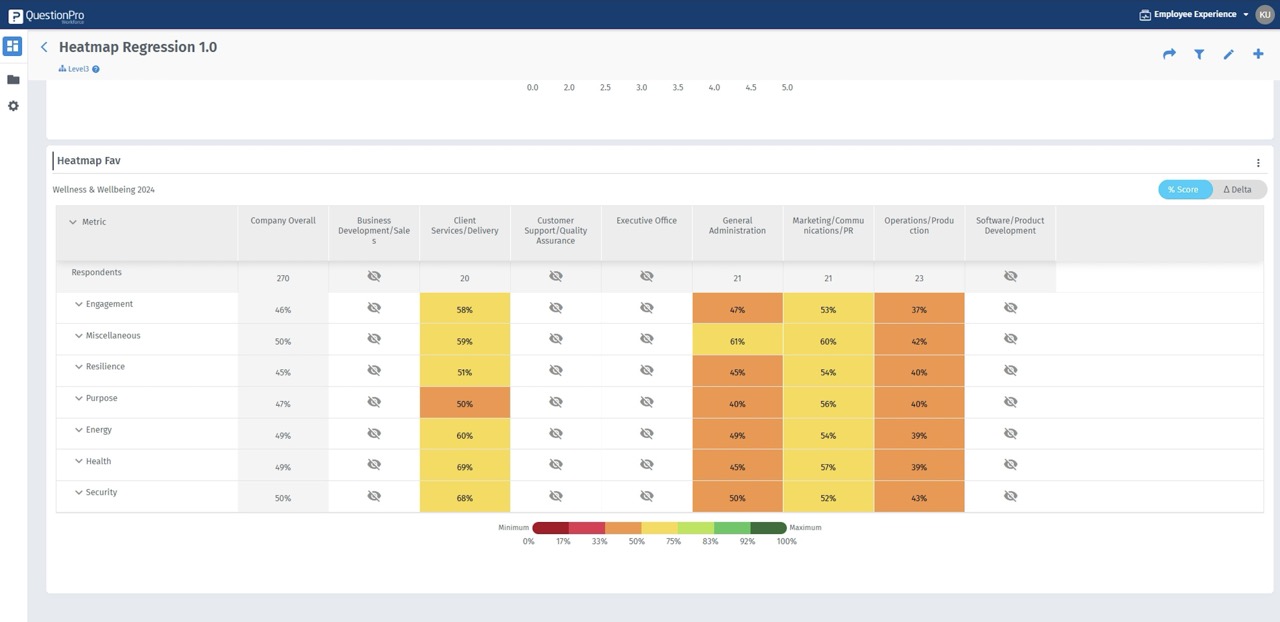
Heatmap default
The heatmap color gradient visually represents your data, making it easier to identify trends and patterns. The color scale used will vary based on your dashboard's theme. The intensity of the color within each range is determined by the actual score.
Below are the calculations and ranges for heatmap default:
-
Favorability percentage
- Dark Green: Scores between 93% and 100%
- Medium Green: Scores between 84% and 92%
- Light green: Scores between 76% and 83%
- Yellow : Scores between 51% and 75%
- Orange: Scores between 34% and 50%
- Medium Red: Scores between 18% and 33%
- Dark Red: Scores between 0% and 17%
How to access this: Create widget >> Heatmap >> Analytics >> select favourability% >> %score(Toggle on the heatmap)
-
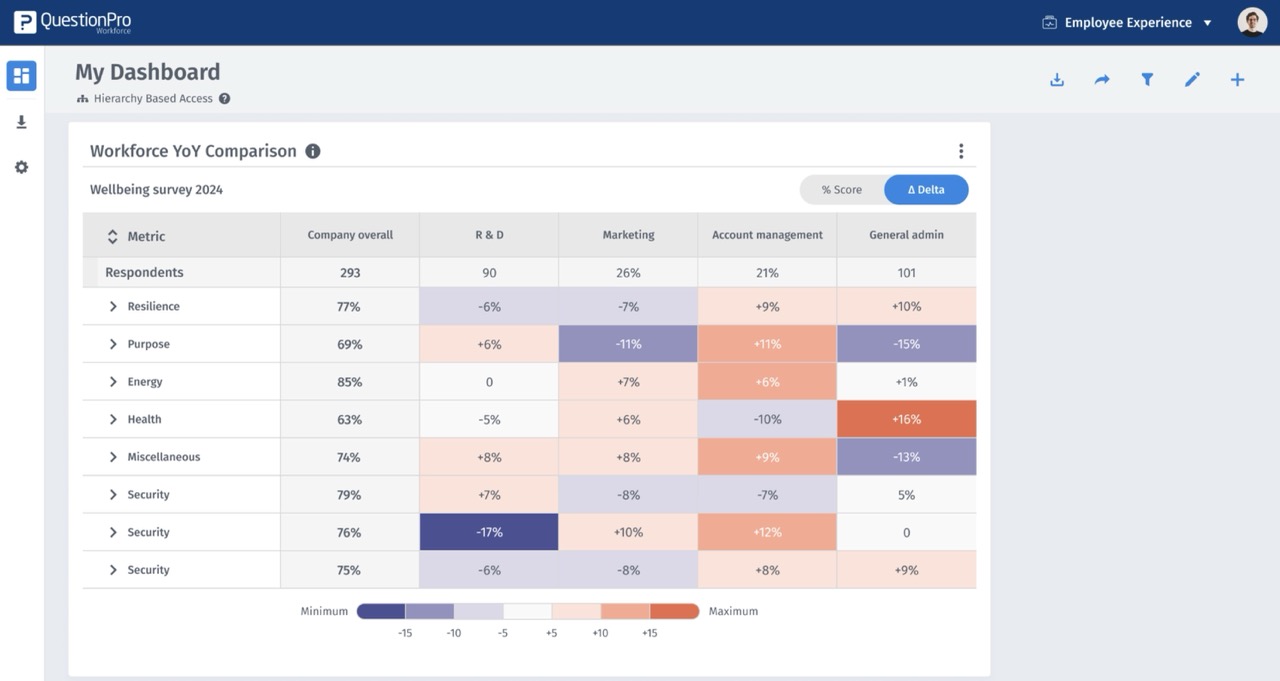
Favorability delta
- Dark Orange: Greater than +15.5%
- Medium Orange: Between +11% and +15%
- Light Orange: Between +6% and +10%
- Light Gray: Between -5% and +5%
- Light Purple: Between -6% and -10%
- Medium Purple: Between -11% and -15%
- Dark Purple: Less than -15.5%
How to access this: Create widget >> Heatmap >> Analytics >> select favourability% >> Delta(Toggle on the heatmap)
-
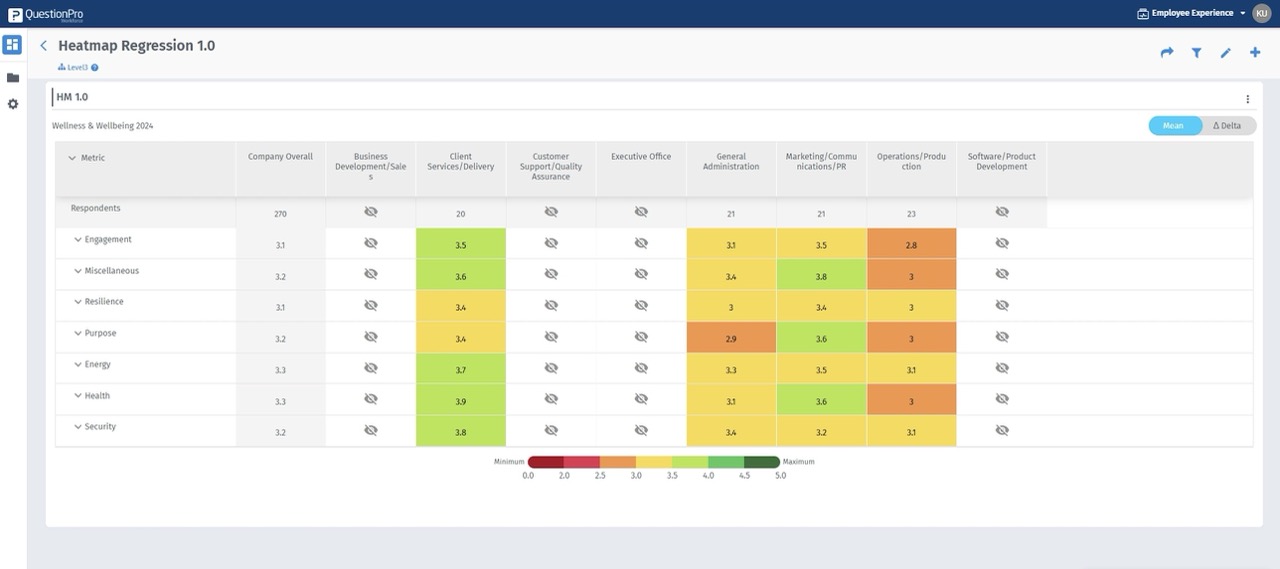
Actual Mean
- Dark Green: Mean score 4.6 and above
- Medium Green: Mean score between 4.1 and 4.5
- Light Green: Mean score between 3.6 and 4.0
- Yellow: Mean score between 3.1 to 3.5
- Orange: Mean score between 2.6 to 3.0
- Medium Red: Mean score between 2.1 to 2.5
- Dark Red: Mean score below 2.0 and below
How to access this: Create widget >> Heatmap >> Analytics >> select Mean >> %score(Toogle on the heatmap)
-
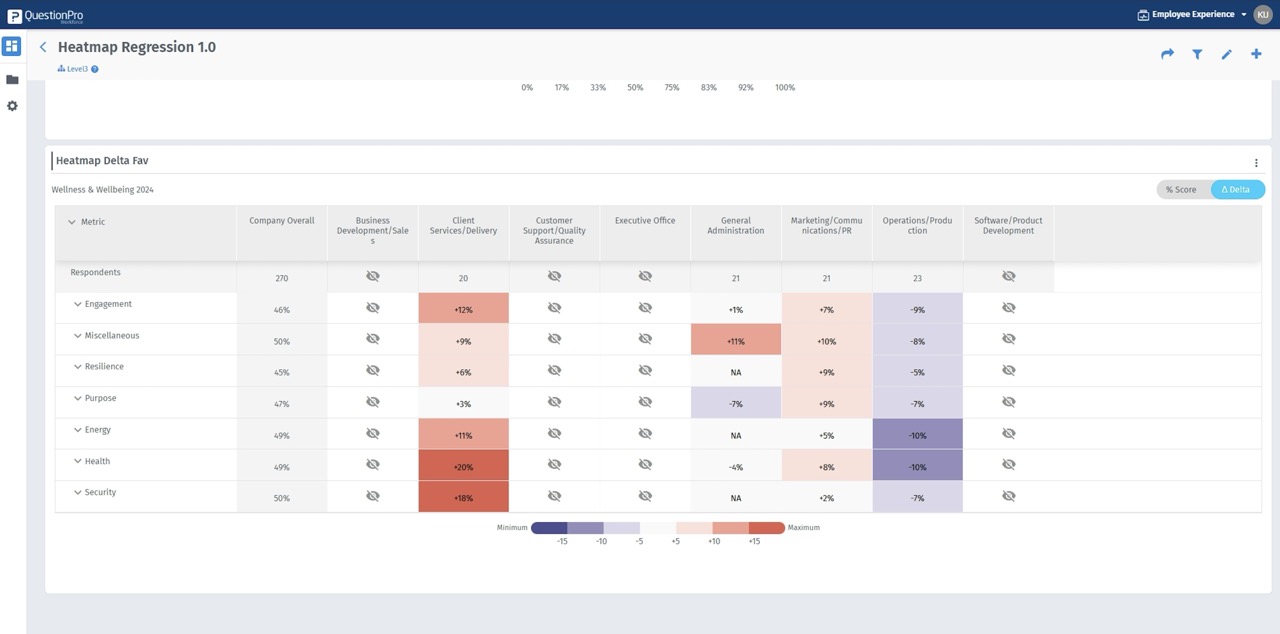
Delta Mean
- Dark Orange: Greater than +1.6
- Medium Orange: Between +1.1 and +1.5
- Light Orange: Between +0.6 and +1.0
- Light Grey: Between -0.5 and +0.5
- Light Purple: Between -0.6 and -1.0
- Medium Purple: Between -1.1 and -1.5
- Dark Purple: Less than -1.6
How to access this: Create widget >> Heatmap >> Analytics >> select Mean >> Delta(Toggle on the heatmap)
You may also be interested in...